
Yesterday’s Pick:
IOC 25APR24 170 CE BUY 8 to 9
ABCAPITAL 25APR24 180 CE 6 to 11
Short term pick PRESTIGE BUY 1250 to 1310 Nifty Technical View:
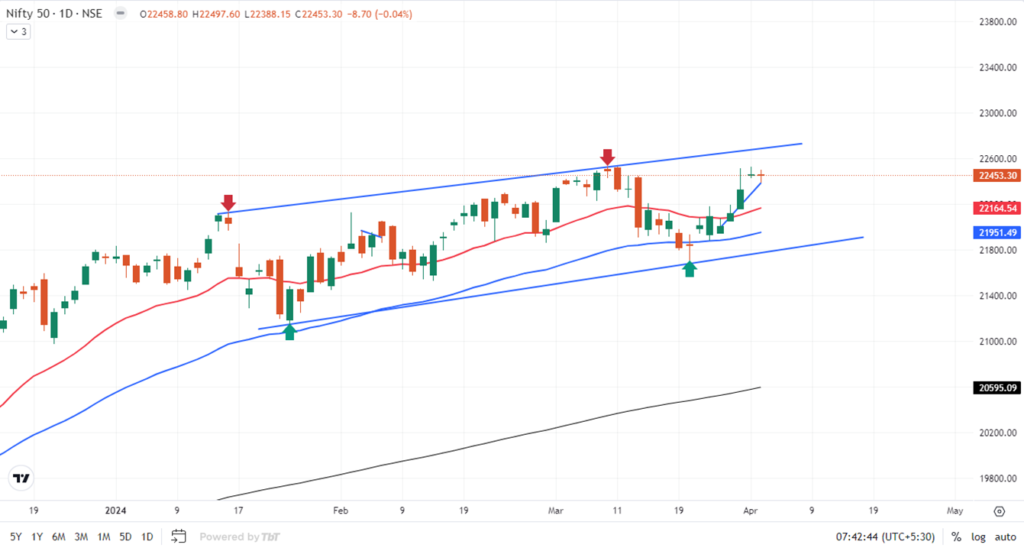
The Nifty formed a small bearish candlestick pattern on the daily charts, characterized by upper and lower shadows, resembling a Doji candlestick pattern. This formation suggests indecisiveness among buyers and sellers regarding the future market trend. It’s anticipated that the consolidation phase will persist in the upcoming days, particularly leading up to the RBI policy meeting.
Indian Vix :
The recent decrease in volatility in the market, as indicated by the India VIX reaching its lowest point since November 24, 2023, is bolstering optimism among investors. When volatility is low, it tends to give investors more confidence, potentially leading to increased willingness to take on investment risks or favoring assets with higher potential returns, thereby supporting a bullish outlook in the market.
FII and DII:
Foreign Institutional Investors (FIIs) sold shares totaling Rs 1,622.69 crore, while Domestic Institutional Investors (DIIs) bought stocks worth Rs 1,952.72 crore.
Put Call Ratio:
The Nifty Put Call ratio , which reflects the sentiment in the stock market, decreased to 1.00, down from the level of 1.07. An increasing PCR, especially above 0.7 or reaching 1, indicates that traders are selling more Put options than Call options, suggesting a growing bullish sentiment in the market. Conversely, if the ratio falls below 0.7 or trends towards 0.5, it means that there is more selling activity in Calls compared to Puts, indicating a bearish sentiment prevailing in the market.
Nifty and Bank Nifty Support and resistance level:
Nifty :- Resistance 22,546 , 22,575 and 22680 levels.
Support 22,410, 22,370 and 22,300 levels.
BankNifty: Resistance 47,650, then 47,790 and 48,000.
Support 47,400 followed by 47,250 and 47,130.
Index Future levels
Nifty Futures Buy above 22600. The suggested targets for this are 22,800 and 22,900, with a stop loss set at 22,480.
Bank Nifty future Buy above 48,100 , the index is expected to see upside levels of 48,300 and 48500, and level 47,700 will act as a stop loss.
Stocks in the news:
HCL Technologies: The IT services firm disclosed that its subsidiary, HCL Investments UK, has successfully sold off 49% of its ownership in a joint venture with State Street International Holdings, a US-based entity. In exchange for this divestment and the termination of associated service agreements, the subsidiary has received $172.5 million.
Todays top pick : Indian Oil Corporation Ltd
IOC : BUY 180 |Target 200| Target 210| Stop loss 160
Indian Oil Corporation Ltd is a Maharatna Company controlled by GOI that has business interests straddling the entire hydrocarbon value chain – from Refining, Pipeline transportation and marketing of Petroleum products to R&D, Exploration & production, marketing of natural gas and petrochemicals. It has the leadership position in the Oil refining & petroleum marketing sector of India.
Indian Oil Corporation Ltd reported a revenue increase of 11% to Rs 1.99 lakh crore for the quarter compared to Rs 1.79 lakh crore in the previous quarter. However, the EBITDA margin saw a decline from 11.9% to 7.8% compared to the previous quarter, with Q2 FY24 EBITDA standing at Rs 21,313 crore. The promoters’ holding remains stable at 51.50%, while there has been an increase in FII holdings from 7.84% to 8.84% and DII holding at 9.90%. The company has been consistently maintaining a healthy dividend payout ratio of 46.4%. In terms of valuation, the industry PE ratio stands at 7.40, whereas the stock’s PE ratio is at 5.25. Considering all these factors, the stock appears attractive and undervalued. IOCL has signed binding term sheet with Panasonic Energy to manufacture Lithium-Ion Cells in India.
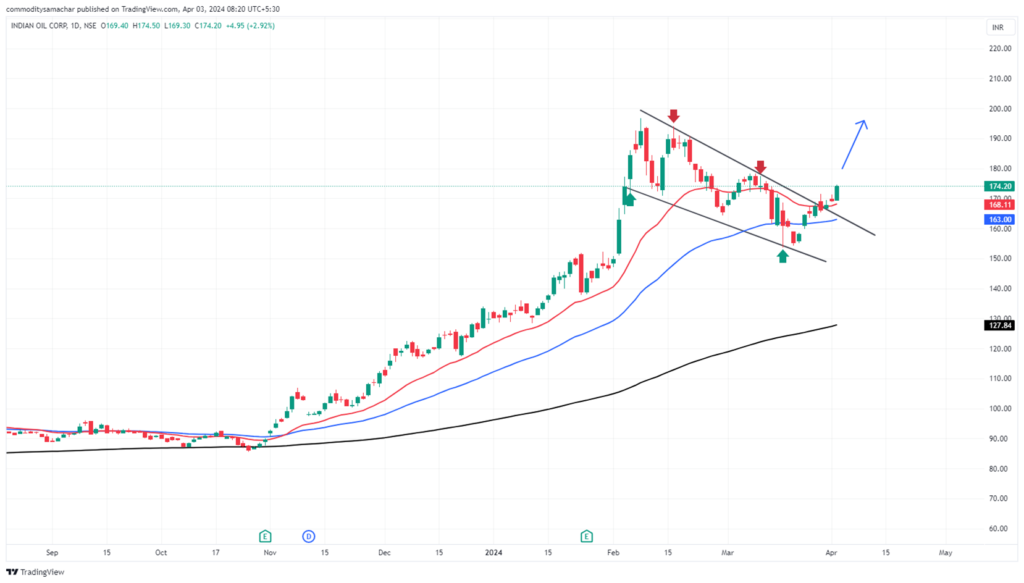
Technical : IOC is had a bullish pattern breakout known as flag. Additionally, the stock has closed above its 21-day moving average, indicating positive market sentiment. A crucial level to monitor is 180, beyond this point could signify a continuation of the bullish trend and may be accompanied by increased trading volumes.
Commodity Samachar
Learn and Trade with Ease
Also Read: A Boost in Japanese Yen: Will it rise from 34 year low against US dollar?
Recommended Read: Forex News Letter: US JOLTS Data and Influences on Gold!
Want help on your trades?