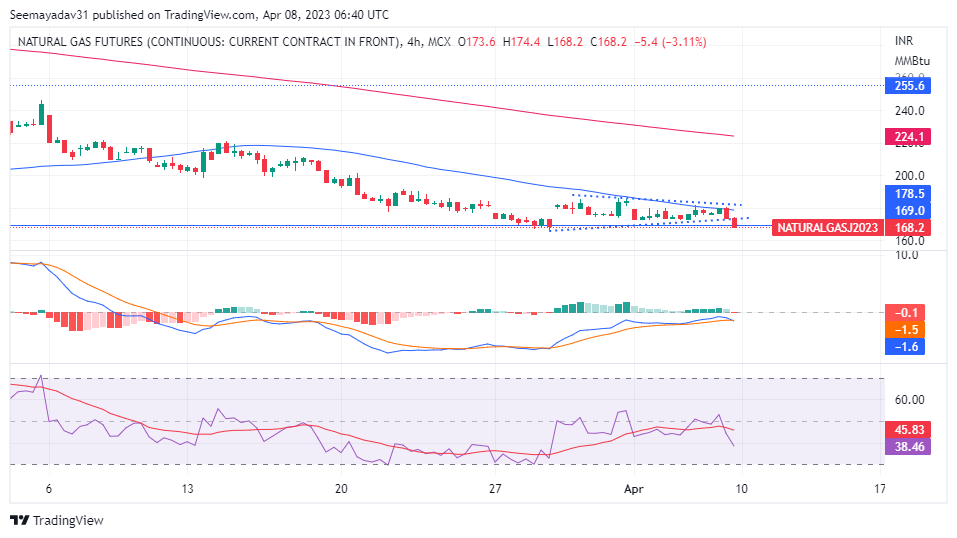
Natural gas tumbled more than 7.90% last week. Natural gas futures resumed their weekly trend in the red, after last week’s respite from three straight weeks of deficit.MCX Natural gas settled at 169.2 compared to previous close of 183.80. On a monthly basis, prices drop by 16.07%.
The prices dropped to the new multi week low 168.2 after a government report showing natural gas storage in the United States fell just a shade below forecast levels last week as cooler-than-normal weather from a historical perspective led to steadier heating demand.
Utilities pulled 23 billion cubic feet, or bcf, from natural gas storage for the week ended March 31, leaving a balance of 1.83 trillion cubic feet, or tcf, the report by the U.S. Energy Information Administration, or EIA, showed
Unusually high storage had triggered a selloff in gas futures since late last year, sending the benchmark front-month on the New York Mercantile Exchange’s Henry Hub to current levels of around $2 from 14-year highs of $10 in August.
Adding to this, temperature analysis from Reuters-associated data provider Refinitiv showed there were around 113 heating degree days, or HDDs, last week, which was more than the 30-year average of 104 HDDs for the period.
HDDs measure the number of degrees a day’s average temperature is below 65 degrees Fahrenheit (18 degrees Celsius) to estimate demand to heat homes and businesses.
Notwithstanding the larger-than-expected draw, this year’s gas storage balance is one of the highest in recent memory and remains the bane of bulls in the market who’ve been trying to restart a spectacular rally they enjoyed just months ago, before an unusually warm winter season led to less heating demand.
Technical – Natural Gas on verge or multi week low if break then new plunge will expect in near future.

Since December 2022, Natural gas turned into a deep bearish trend. Prices continued to tumble from the peak 586.40 to recent low 168.20, down more than 90% in the last four month. Further, on quarterly basis prices dropped by 51%.
On the above intraday chart, Natural gas breached short term consolidation support and formed a long bearish candlestick.
Further, RSI 14 and its 9 SMA is indicating a negative crossover. As well, prices are trading below its short term moving average.
Both aspects are still indicating bearish momentum in the near future. However, prices would need to break crucial support 165.00 on a closing basis, coincided with multi week low.
A break below 165.00 will lead prices towards next support 145.00-128.00 very soon.
Alternatively, failure of the break only will create a probability for short term pullback. And prices are expected to test immediate resistance 178.00-190.00 in near future.
