

Gold price fell to near two-week lows on Wednesday, weighed down by gains in Treasuries and the US dollar. Bond yields have risen sharply in recent sessions. The price is under more pressure after the US Federal Reserve published the minutes of its December meeting, which did not provide any clues.
The dollar jumped over 1% as investors reassessed their expectations for a rate cut by the US Federal Reserve this year. The market was cautious after last month’s impressive risk-off.
The greenback was on the front foot in early deals in Asia, as trading returned to full swing with Japan back from an extended New Year break.
Against the yen, the dollar stood near a two-week peak and last bought 143.09 yen, having jumped more than 0.9% against the Japanese currency in the previous session, its best day since October.
According to the minutes, most Fed officials see interest rates likely at or near peak levels, although “several participants highlighted uncertainty about how long to continue tightening.” Although participants noted progress in inflation, basic services remain at high levels.
It must be said that several participants may want to keep prices at current levels longer than they currently expect. In addition, economic data released by the Institute for Supply Management (ISM) showed that manufacturing activity remained at recession levels for 14 consecutive months, while the JOLTS report released by the US Department of Labor indicated that the labor market is cooling.
Technical Outlook – Gold price:
.
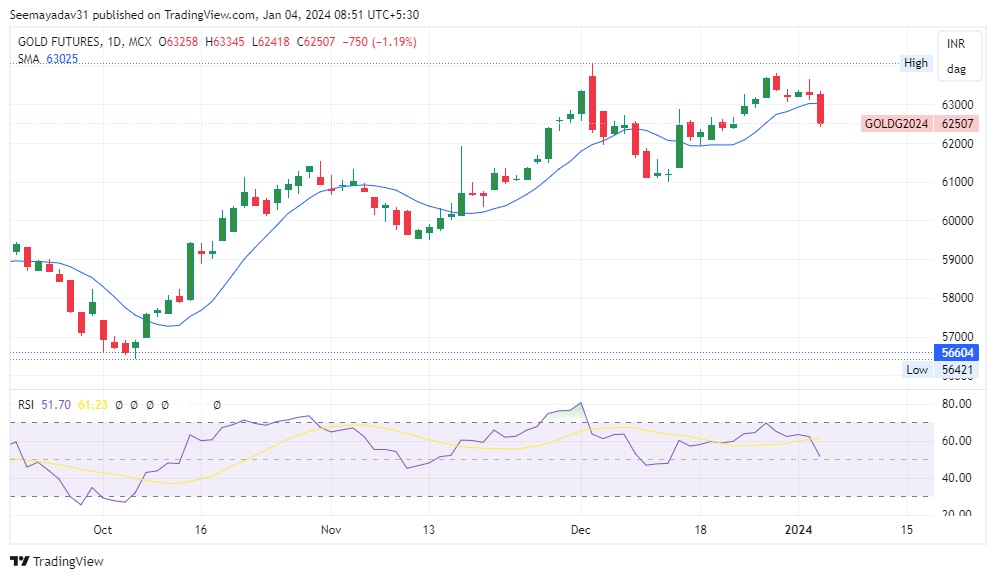
The gold price fell by more than 1.19% yesterday. Since December 29, 2023, prices have continued to decline, retreating from 63653 and yesterday made a low of 62418 and settled at 62507..
The dark cloud candlestick caused the price of gold to fall sharply. According to the opinion given on 29.12.2023, it was proven accurate. And after breaking the important support at 63150, prices fall below the target of 62800-62580.
The formation of a long bearish candlestick pattern on the above chart indicates further decline. Apart from that, the negative trend is also supported by RSI 14 and its 9 SMA. Now, the downside is that crucial support is seen at 62280 and holding a trade below it may soon pull prices to 62020-61650. Otherwise, any rise to 62750-62800 could attract selling pressure.
Alternatively, there is immediate resistance on the upside at 63350 and a further upside could go above it the next resistance is 63650-64050.
Therefore, traders must be careful watch crucial support because the price of gold can correct further if break it.
Commodity Samachar
Learn and Trade with Ease
Also Read: Crude Oil Trading with Key Support, Will It Break Or Not? , Will US FOMC minutes and JOLTS Job drive market drive sentiment today?
Recommended Read: Forex News Letter: FOMC Meeting Minutes to take hold of market movements?
Want help on your trades?