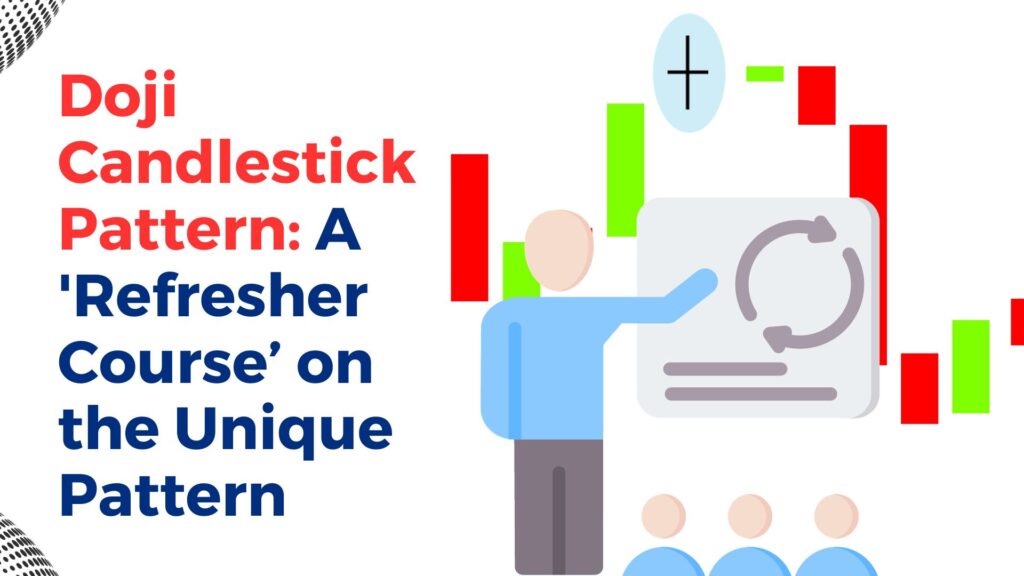
As traders, there are certain aspects of the trading game that we need to get in front of. One of them being chart patterns, especially the Doji candlestick pattern.
As our avid readers, you’ll be curious about the various chart patterns we enumerate on our technical outlooks on commodity markets as well as the Stock markets. Now it’s time to teach you what they represent.
So in the world of technical analysis in financial markets, candlestick patterns play a crucial role. These patterns help traders interpret price movements and make informed decisions.
Out of these patterns, one of the most intriguing and significant patterns is the Doji candlestick.
Through this informative blog, we’ll take you from points A to B concerning Doji candlestick patterns and their implication on the financial markets.
The market doesn’t wait for anyone, so without further adieu, let’s begin!!
What is a Doji Candlestick Pattern?
A Doji is a candlestick pattern that indicates a state of indecision or a tug-of-war between buyers and sellers in the market. It forms when the opening and closing prices of an asset are very close, if not equal. The resulting candle has a small real body, representing minimal price movement during the given period.
Anatomy of a Doji Candlestick Pattern:
As every organism has some kind of anatomy, the Doji candlestick is also the same. So let’s begin!!
Open: The price at which the asset opened during the specified period.
Close: The price at which the asset closed during the same period.
Upper Shadow: The vertical line above the real body, representing the highest price during the period.
Lower Shadow: The vertical line below the real body, signifying the lowest price during the period.
Types of Doji Candlestick Patterns:
The doji candlestick comes in various forms and shapes, so knowing every one of them will be an asset in your arsenal and could make your trading journey a tad bit easier.
Classic Doji:
The open and close prices are virtually identical, creating a small or non-existent real body. It suggests strong indecision in the market.
Long-Legged Doji:
The open and closed prices are close to each other, but the high and low prices have a significant range. It implies extreme volatility and uncertainty.
Dragonfly Doji:
It is a pattern that’s usually found at the bottom of a downtrend that signifies rejection of lower prices.
The open, high, and close prices are the same, forming a ‘T’ shape. It indicates a potential bullish reversal.
Gravestone Doji:
The open, low, and close prices are the same, forming an inverted ‘T’ shape. It usually appears during an uptrend displaying market rejection for a higher price.
It suggests a potential bearish reversal.
4 price Doji:
This specific type of doji candlestick pattern is represented by a single horizontal line that depicts the ultimate indecision in the market. This pattern usually appears when open and closed and high and low are all depicting the same appearance.
Doji Star:
The doji star like its name looks like a star with the same opening and closing values with equal length upper and lower wicks. it usually appears when neither the bullish nor bearish trend is significant enough to sway the market sentiment.
Interpreting a Doji Candlestick Pattern:
A Doji after a prolonged or extended uptrend might signal a potential trend reversal to the downside and vice versa after a downtrend. The length of shadows and overall pattern context is crucial. Long shadows suggest increased volatility and potential trend reversal.
Doji within a trading range can indicate a potential breakout and it is a part of a more extensive pattern (e.g., Morning Star or Evening Star) that can enhance its significance.
Final Note:
Knowing about chart patterns can help you traverse through the market effortlessly. The Doji candlestick pattern is a potent tool in a trader’s arsenal, providing insights into market indecision and potential trend reversals.
However, like any technical tool, it’s essential to use the Doji in conjunction with other indicators and consider the broader market context.
We hope that was informative. We’ll be back with more informative blogs soon.
Until then, Happy Trading!!
Commodity Samachar
Learn and Trade with Ease
Also Read: The Elliot Wave Theory – A Fundamental Concept All Analysts Should Know!! , Understanding the Non-Farm Employment Data