commoditysamachar.com – The market opened up to news of a significant shortage in the crude oil inventory from 5.0 M to 1.5 M.
The crude oil futures last rose 68 cents or 0.9% to $77.52 a barrel by 0330 GMT. Whereas, the U.S West Texas Intermediate crude(WTI) gained 75 cents, or 1% to $73.66 a barrel.
Data from the American Petroleum Institute(API) displayed that the US. inventories shrank at a significant pace in nearly 6 months over the past week. The demand has increased ahead of the travel-heavy summer season. With forecast inventory at 0.525 M the Actual levels of inventory have gone down to -6.799 M.
Warnings signs have been noticed from the Saudi Arabian energy minister’s end against shorting oil that also pushed up the prices. It was a direct result of the recent production cuts by OPEC, which, along with indications of rising demand, raised predictions of a short-term supply shortage.
On Tuesday, talks between Democratic and Republican members went on as usual, but neither side gave many hints on when a compromise would be struck. This occurs right before the U.S. is due to default in June, which could have significant effects on the world economy.
Technical Outlook:
As per data received from our research analysts, an ascending triangle chart pattern has been visible in the market. For those who don’t know, here’s what an ascending triangle pattern is.
Ascending Triangle Chart Pattern:
As the name suggests, an ascending triangle chart pattern is a tool that researcher analysts use while technically analysing things. The pattern is created because of the price moves. A horizontal line is drawn along the swing high(an indicator from where the price of a commodity might drop) and between a rising trendline that has to be drawn along the swing lows.
Traders usually watch for a breakout from these triangle patterns, and it may be forming upside or downside patterns.
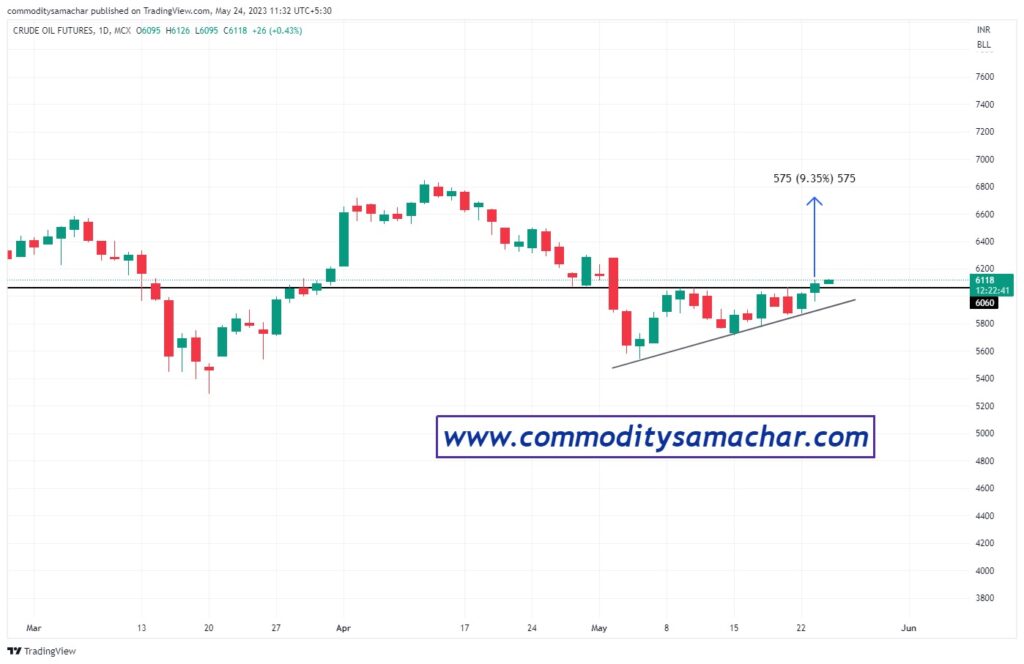
The ascending triangle seen in the market charts today has made a healthy breakout above 6050 levels and can be considered positive on the charts.
Analysts suggest that after the break its minimum upside target shall be 575 points. That is close to a breakout of a minimum target of 75 points.
According to these patterns, traders can buy crude oil at 6050 – 6000 levels. The stop loss level shall be below 5850 on closing for the upside target of 6650.