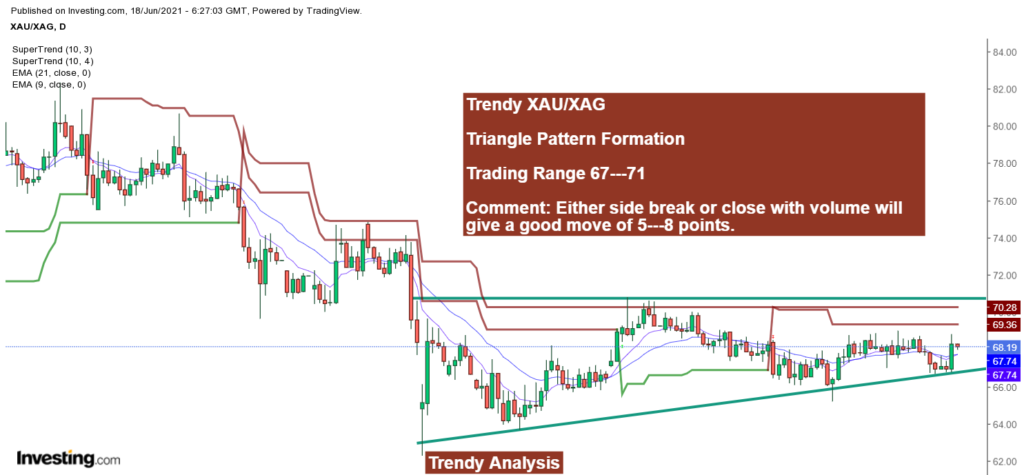

Trendy XAU/XAG – Gold/Silver ratio
As per our chart analysis- Presently, the Gold/Silver ratio is trading around 68.27 and we look deeper into the chart then the major hurdle is at 71 thereby providing support at 66.50. Traders may do a fresh buying above 71 levels only otherwise it may test the support of 66.50 levels again.
Furthermore, if the Gold/Silver ratio crosses and settle above the 71 mark, then we may see levels between 74 —75.50. More and more upside rally we will see on a close above 75.50 levels till 78 in the days ahead. Otherwise, we may find a reversal from 69—69.50 levels.
If we look deeper in the chart, the Gold/Silver ratio is forming a triangle pattern which reflects that there are high chances of meeting a target of 66.50. If further the support breaches and close below 66.50 with volume then the target may go beyond 61 —58 levels.
Till then trendy traders are free to trade within a range and may wait for confirmation.
Moreover, 21 and 55 days moving average is at 67.70 and 67.90 which reflects range-bound trading in Gold/Silver ratio between 67 — 71 levels.
For more updates, stay connected with us!!