Nifty futures formed a red DOJI pattern on the weekly chart of bank Nifty and settled around 15696.70. Nifty futures has support at 15450 and resistance at 16000. Fresh buying we will do on a close above 16000 levels only or else it could test its support level of 15450 again.
More and more downside panic we will see on a close below 15450 levels only.
Three consecutive close + weekly close below 15450 will take it to 15050—14700 and then to 14300 levels too in days to come where we will find support in Nifty.
Or else it could test its resistance level of 15750—15900 again.
We will find the best buying opportunity in the Nifty future around 14300 levels. Aggressive buying we can see above 16000 levels but chances are unlikely to breach its resistance level in near terms as shown in the figure. Hence, traders can trade safely as per the levels.
What to expect in Trendy Bank Nifty?

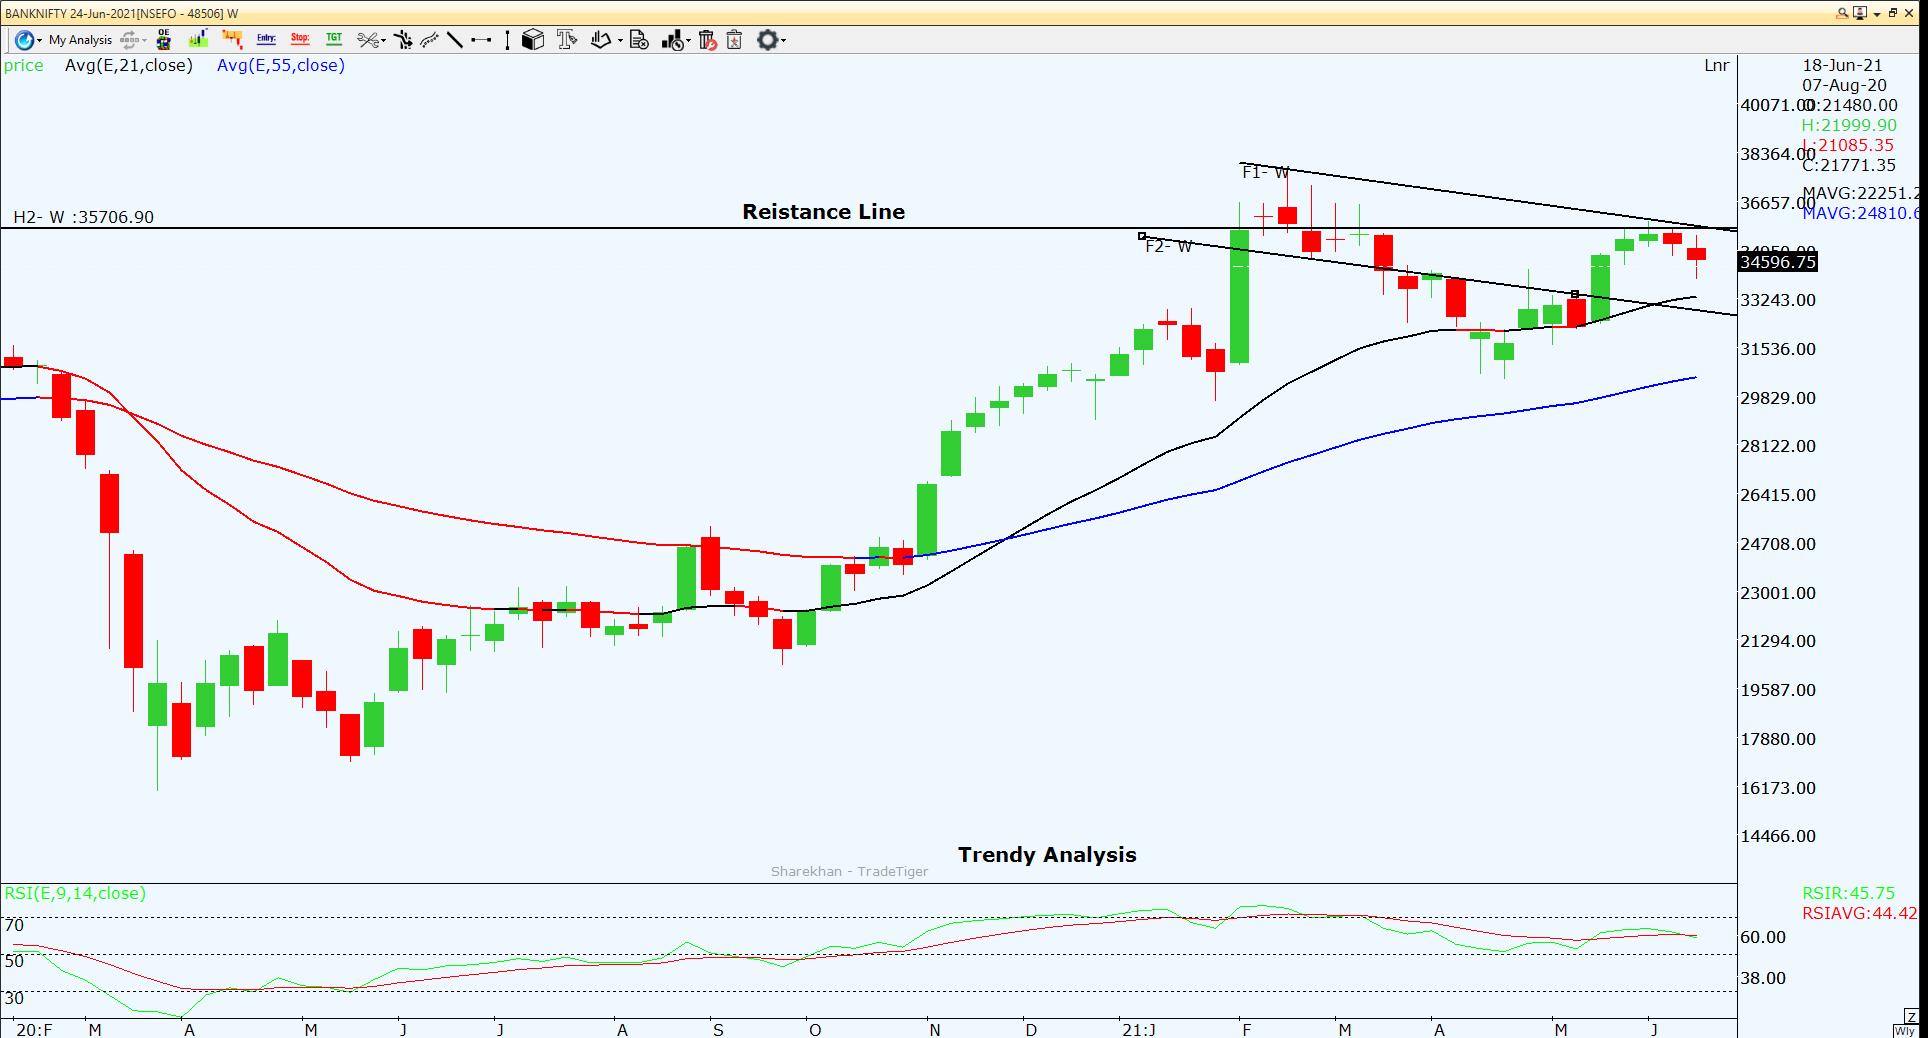
As shown in the figure, Bank Nifty futures has crucial resistance at 35300—35750 levels. Two base red candles formed on the weekly chart suggest that an enthusiastic long candle may form in the next week.
Bank Nifty already underperformed as compared to Nifty because of economic pressure in Bank Nifty. Here we are in make or break situation in Bank Nifty as per trendy chart analysis.
If Bank Nifty trades below 34500 then it could test 33700—33400 and then to 32500 levels too in days to come. Traders should remain cautious around 32500 levels as Bank Nifty could take support from lower levels. On seeing global markets, chances are unlikely to breach the resistance level of 35750 in near terms until and unless any major news comes out from developed economies.
Fresh breakout in Bank Nifty we will see above 35750 levels. Three consecutive close + weekly close above 35750 will take Bank Nifty to 41000+++ levels in days to come.
Alert: Nifty and Bank Nifty are on make or break situation. So keep trailing stop loss.
Trendy Investment- SUNTV

SunTV is involved in producing and broadcasting satellite television and radio software programming in the local languages of South India. Suntv is debt-free and maintaining a good return on equity of 24.47% in the last three years. Sales growth dropped in the last 5 years but a sustainable company. Chances are bright for a fundamental revival in the company.
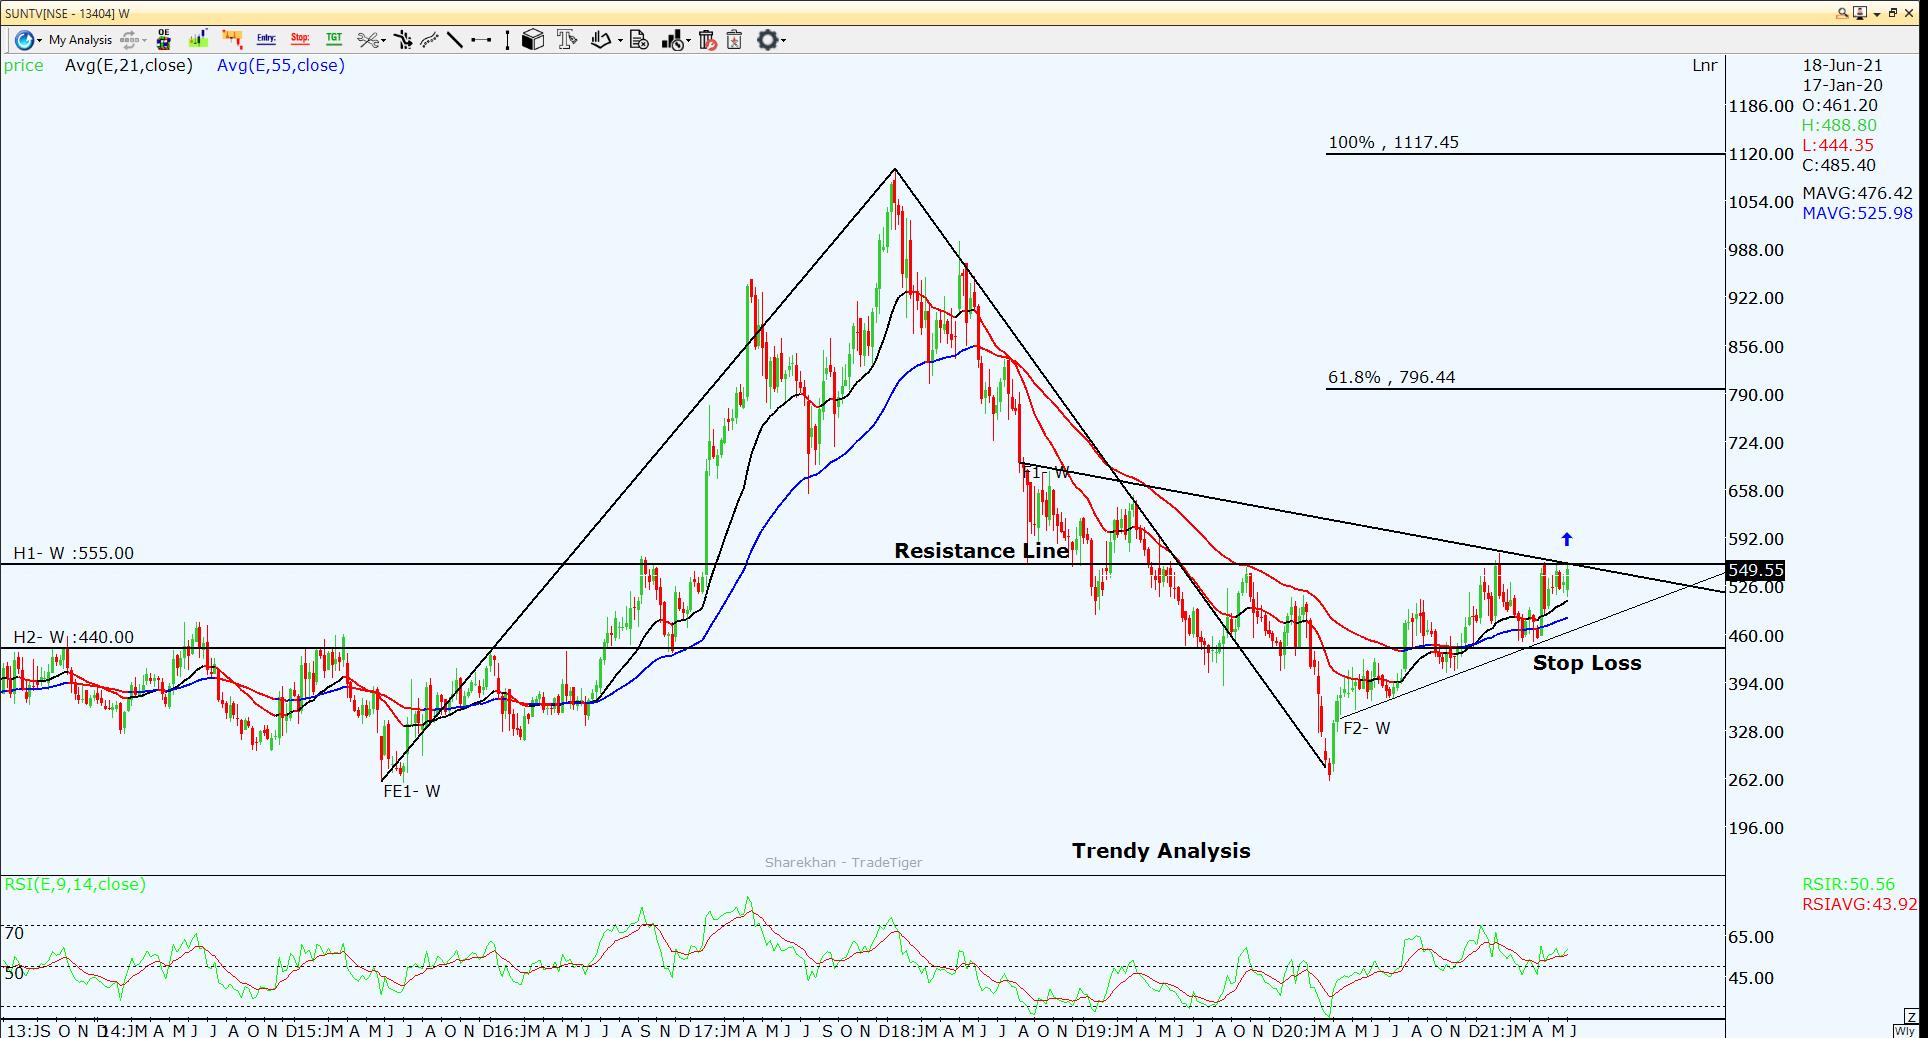
Rounding bottom pattern formation is seen on the daily chart and the breakout level is at 555. The lower side is very limited in SUNTV as shown in the figure. A healthy crossover of 21 DEMA and 55 DEMA is indicating strength on the weekly chart. RSI too crossed its middle average line on the weekly chart.
Suntv has resistance at 555 levels. Break and close above 555 will see a momentum buying in the stock. Fibonacci extension suggests the upside target of 796 and 1117 levels in the next 1-year time frame.
Recommendation: Buy Suntv in cash above 555 with stop loss below 440 for an upside target of 796 and 1117.
