
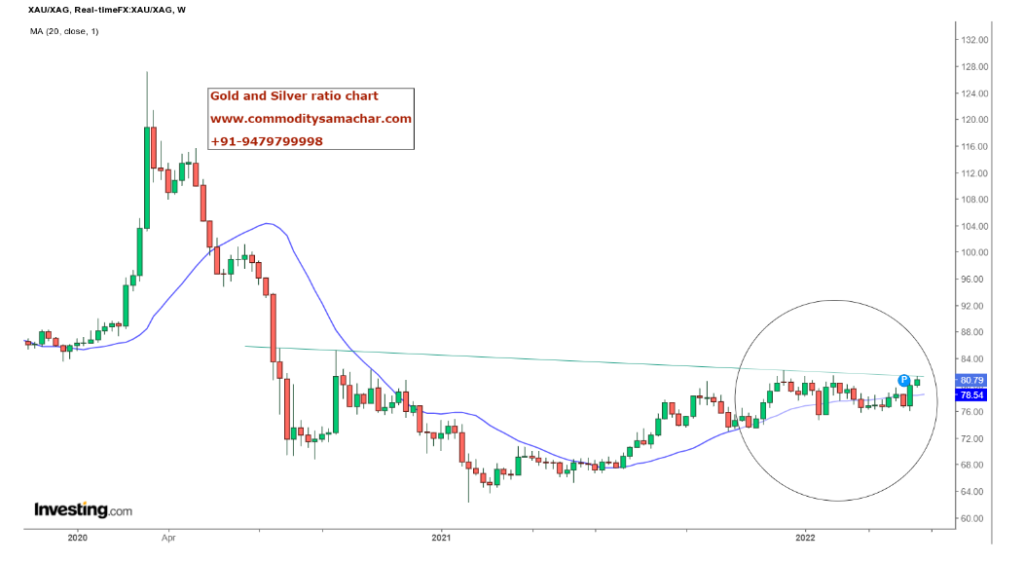
As seen in the above chart, there is a trend line resistance in XAU/XAG on the weekly chart which depicts the Gold and Silver ratio.
The Gold-Silver ratio chart is trading near its resistance level of 82.25 on the weekly chart. Three consecutive closes + weekly close above 82.25 will see a nonstop tally till 85—88 levels in days to come
On the other hand, the XAU/XAG ratio prices crossed 20WMA which is also showing strength on the chart.
If the above condition is fulfilled and Silver successfully breached the resistance level of 82.25 then Silver turns weak more than Gold and we should adopt a strategy of buying Gold and selling 2 lots of Silver for time being.
Silver… A weekly close below $23.90 will take it to $22.75—$21.50 levels soon.
So trade safely as per the levels given above. If any reversal seems then surely we will update during market hours to our subscribers.