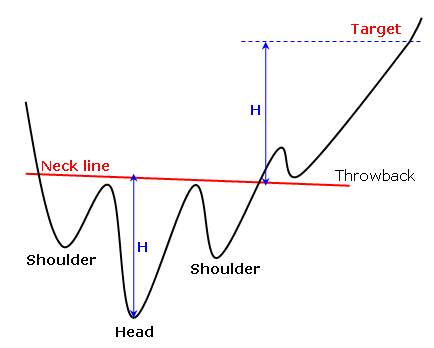
An inverse head and shoulders, also called a “head and shoulders bottom”, is similar to the standard head and shoulders pattern, but inverted: with the head and shoulders top used to predict reversals in downtrends.
This pattern is identified when the price action of security meets the following characteristics: the price falls to a trough and then rises; the price falls below the former trough and then rises again; finally, the price falls again but not as far as the second trough. Once the final trough is made, the price heads upward, toward the resistance found near the top of the previous troughs. (Investopedia)
Candlestick chart
Line Chart

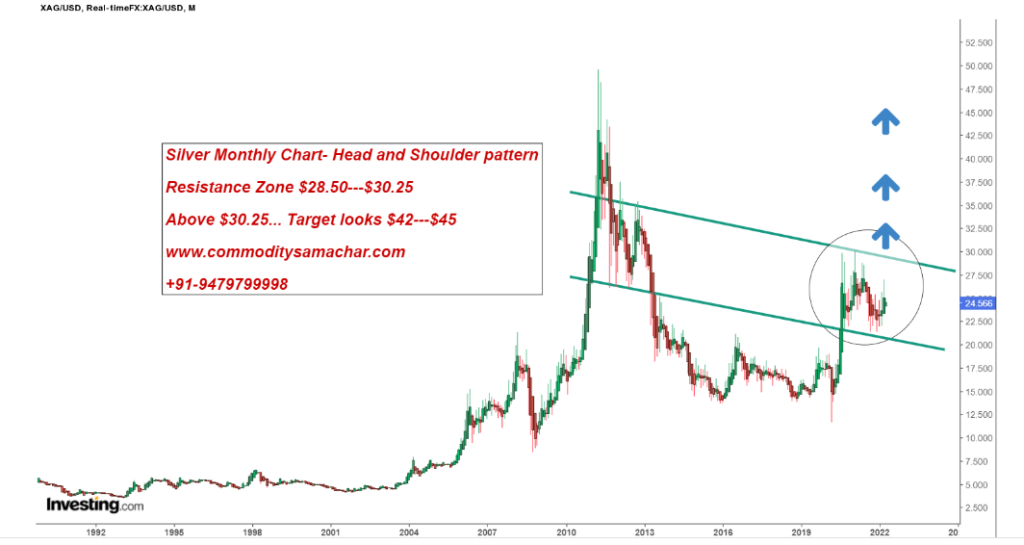
On seeing the monthly chart, Silver is forming an inverted head and shoulder pattern which resembles the chart attached. This is the most powerful chart in our technical analysis theory. Silver is in a long consolidation for the last 22—25 months and we expect some more time to trade within a range. Hence, this is a good time to buy and accumulate silver in panic around $24—$21 for the initial upside target of $28.50—$30.25.
Three consecutive weekly closes + monthly closes above 30.25 will take Silver to $42—$45 in the coming months. Silver never crossed the level of $50.00 in its entire history. So we have to see whether this time Silver will break the Golden jubilee level or not?
On the calculation front- The silver breakout range is $28.50—$30.25. The inverted head and shoulder pattern length is approx $14. So if we add $14 to $28.50 then it comes to $42.50. It’s our positional view. So trade on our levels accordingly.