Reliance industries…most popular company in India is on the verge of breakout on the weekly chart. Moreover, Reliance Industries stock is in the long consolidation phase for the last 10—12 months and now trading on the verge of a breakout. a well renowned company is forming a Pennant pattern on the weekly chart as clearly shown in the figure.
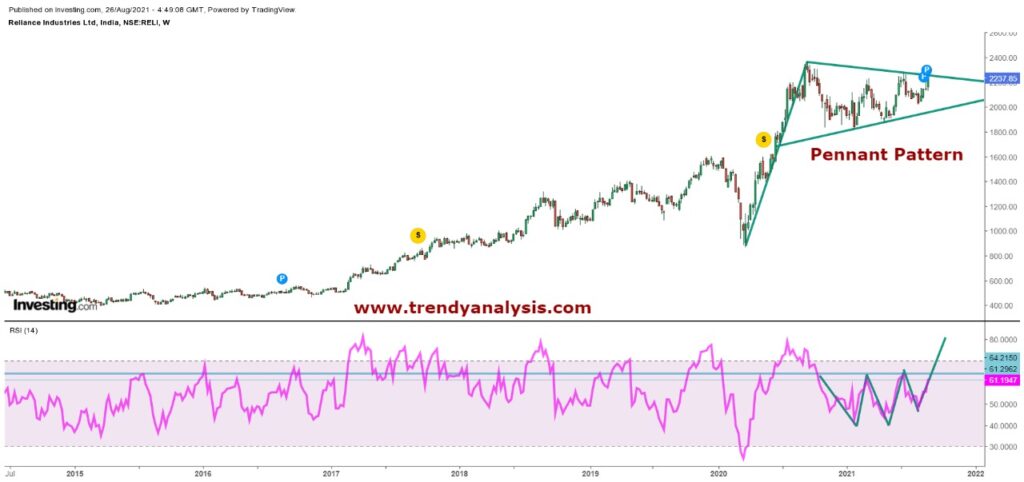
In the month of September 2020, it made a high of 2369.35 and low of 1830 in the month of January 2021. A big consolidation of almost 550 points range at higher levels in the bull market created strength in the stock.
Technical Outlook
Reliance industries has resistance at 2250. Three consecutive closes + weekly close above 2250 will take it to 2750+++ level in days to come.
A strong pennant pattern on the weekly chart suggest us a medium to long term target of 3600 in it.
Our positive view in Reliance industries gets negate on a close below 1900 levels only.
On the weekly chart, RSI (9,14) has already given healthy crossover above average line. However, RSI is forming head and shoulder pattern which suggests us strength in the stock.
If we talk about demand and supply, then demand likely to increase above 2250 levels.
Looking deeper into the scenario, it seems that the large cap stocks like Reliance and HDFC Bank will take Nifty index to more upside levels.
Here we recommend our readers that don’t go aggressive selling in the stock as this stock looks trendy as per technical analysis.
Healthy formation on the chart suggest us that bullish trend remain continue in the stock.
For more details, you can consult with your financial investment adviser.
For more relevant info and updates; Keep scrolling our website www.trendyanalysis.com. If any reversal seems then surely we will update on our blog.