
From the last few trading sessions, precious metals are trading in a very tight range and there is no major news in the market. Crude oil moved up sharply while Natural gas crashed from the top. Global tensions are on but this time there is a tension of inflation. Countries are facing to control their inflation rates but are not able to manage them right now. A cold war seems to start again between US and Russia. Precious metals and stock markets are in shock because of continuous discussion about interest rate hikes. So with the fundamentals, let’s discuss technical charts of XAU, XAG, and XAU/XAG.
Precious metal- Gold
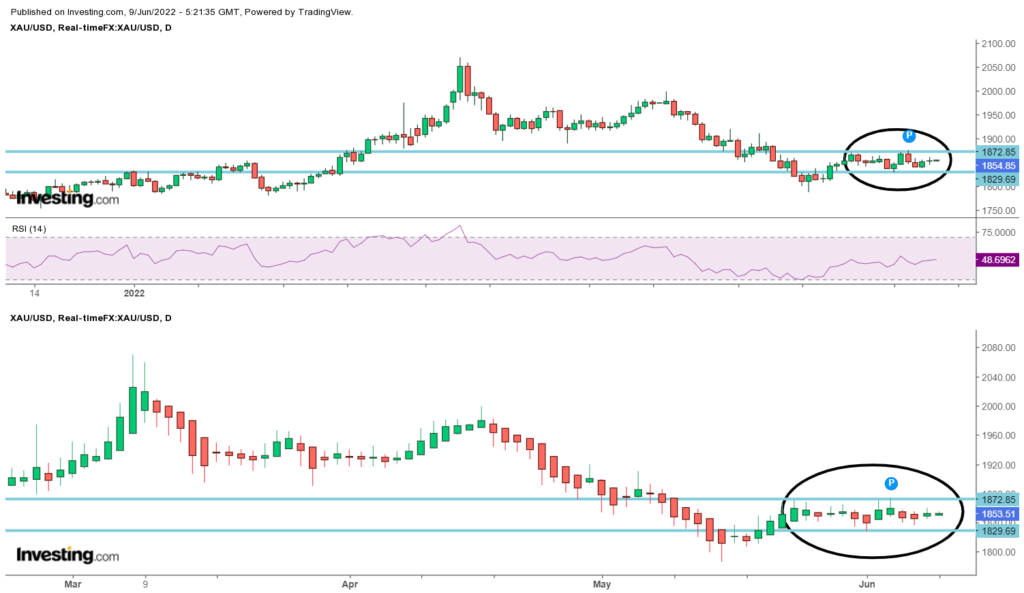
From the last 12 trading sessions, precious metal Gold is trading in a range of $1830—$1875 and forming a rectangle pattern on a daily chart. Today is the 13th day and as per the Fibonacci number, we expect a breakout in today’s trading session. If it fails to settle above or below the mentioned specific range then this consolidation may extend to the next 4 to 7 trading sessions.
This type of consolidation is good for the market as it will give clear direction after breakout but as per the study, rectangles breakout has many whipsaws.
Coming back to the chart… A decisive break above $1875 will take it to $1905—$1920. Panic is likely to start below $1825 only.
Precious Metal- Silver
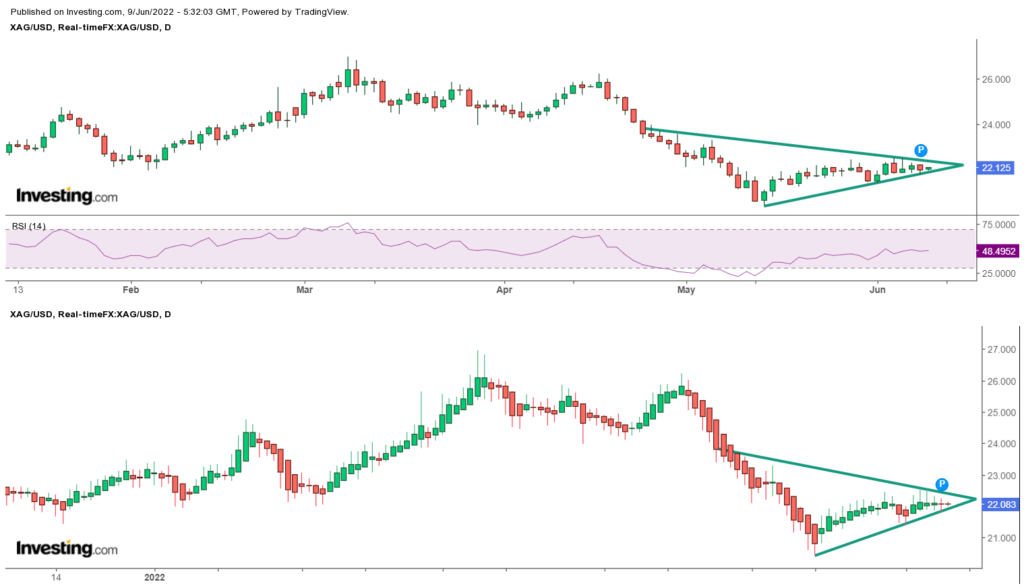
On the other hand, the precious metal Silver is too traded in a very tight range and forms a triangle pattern on the chart. We need a healthy breakout to move further. Silver is having support at $21.75 and resistance at $22.55. Either side breaks with volume will decide further. Till then traders can trade in a range and wait for confirmation.
Gold and Silver Ratio
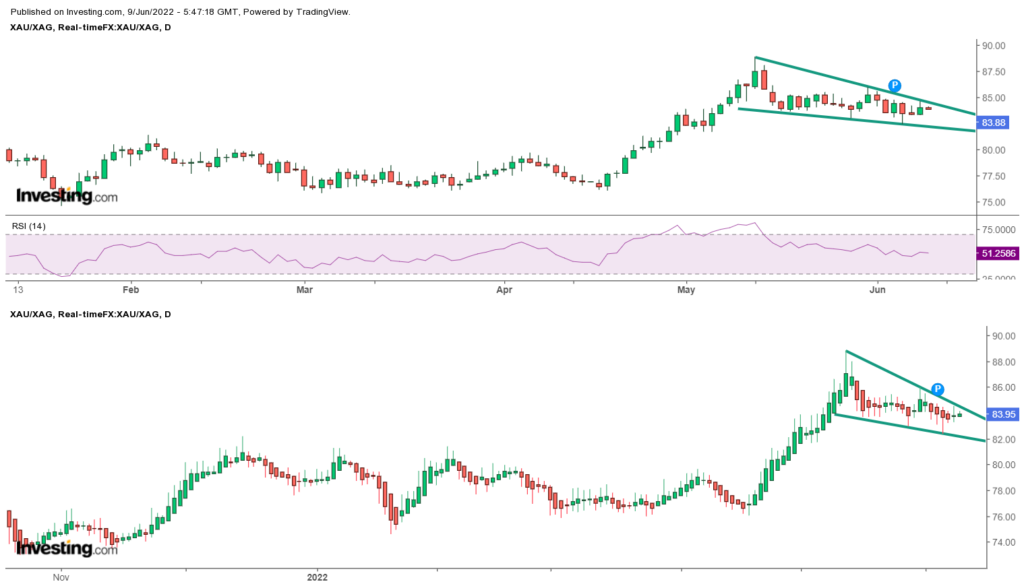
Now, look at the Gold and Silver ratio chart. The gold and silver ratio i.e XAU/XAG looks pennant pattern on the daily chart which is a continuation pattern. It has resistance at 85.00 and support at 82.00. Pennant pattern has a pole of almost $9. So here, chances are bright for a sharp upside move in the ratio of the precious metals.
Three consecutive closes + weekly closes above 85.00 will take this ratio to 93—94 levels in days to come. If this happens then that will be a disaster for Silver as compared to Gold. On seeing a complete analysis, the trend for Silver does not seem too much enthusiatic.
So traders can trade as per the above-given analysis. If anything major seems then surely we will update during market hours.