Natural gas futures have stalled their recent gains and gave up more than three per cent yesterday. It was the first intraday losing streak since 20 June 2023.
Today, U.S. gas storage is due to release from the Energy Information Administration, or EIA.
U.S. utilities expect to add 83 bcf, or billion cubic feet as compared to In 95 bcf in the previous week.
It has been an interesting time for natural gas, with bulls managing to keep the market in the positive for most of the month.
With a near 18% gain for June, gas futures are headed for their best month in almost a year. The last time the market rallied more in a month was in July 2022, when it gained 46%.
While summer weather hasn’t hit its typical baking point across the country. Cooling demand is inching up by the day, particularly in Texas. This has sparked the realization in the trade that higher price lows might be more common than new bottoms. The lowest Henry Hub’s front-month got to this week was $2.647, versus the $2.136 bottom seen at the start of June.
Indicators on air-conditioning demand, released Thursday by Refinitiv, the data arm of Reuters. Showed there were around 65 CDDs. Or cooling degree days, last week close to the 30-year normal of 70 CDDs for the period.
CDDs, are used to estimate demand to cool homes and businesses. Measure the number of degrees a day’s average temperature is above 65 degrees Fahrenheit.
August gas lost 12.1 cents, or 4.3%, to settle Wednesday’s session at $2.668 per mmBtu. Or metric million British thermal units. That was in addition to the prior day’s drop of 3.6%.
The two-day slide positioned natural gas for a drop of more than 6% on the week after a near 25% rally over three prior weeks.
Technical Outlook
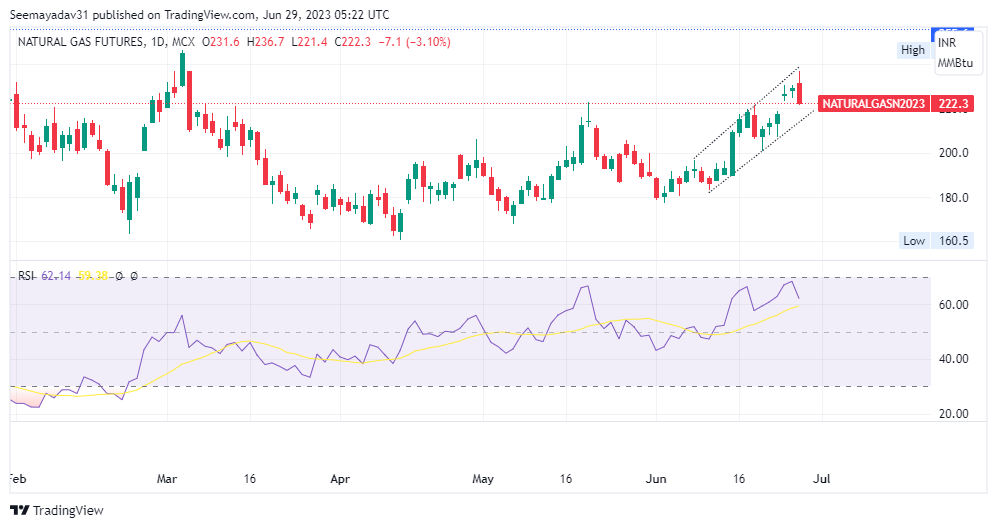
Since 13 June 2023, Natural gas futures have been trading in an upward direction. Prices gained nearly 16% from the bottom of 183.10. Yesterday, the price retreated by 3% and after breaching February 2023 high, settled at 222.30.
On the above chart, the formation of the long bearish candlestick is indicating a short-term dip in Natural gas prices. However, the downside level seems to be limited, as it’s expected that any temporary correction will witness a pullback again until prices give closing below 198.50.
On the downside, crucial support is seen at 198.50 and a break below only will put pressure. Prices may test next support 185.00-180 again.
Hence, traders should wait for a dip for fresh buy