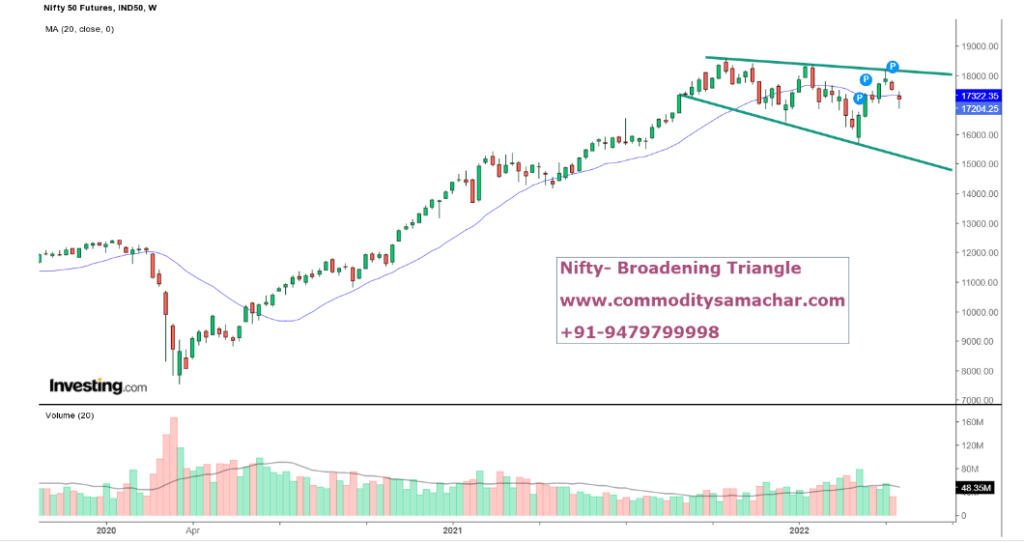
At the close, Nifty concluded lower with 220.60 points or 1.27% and marked at 17,172. For the last two weeks, the market was range-bound thereby trading with a negative bias for traders or investors.
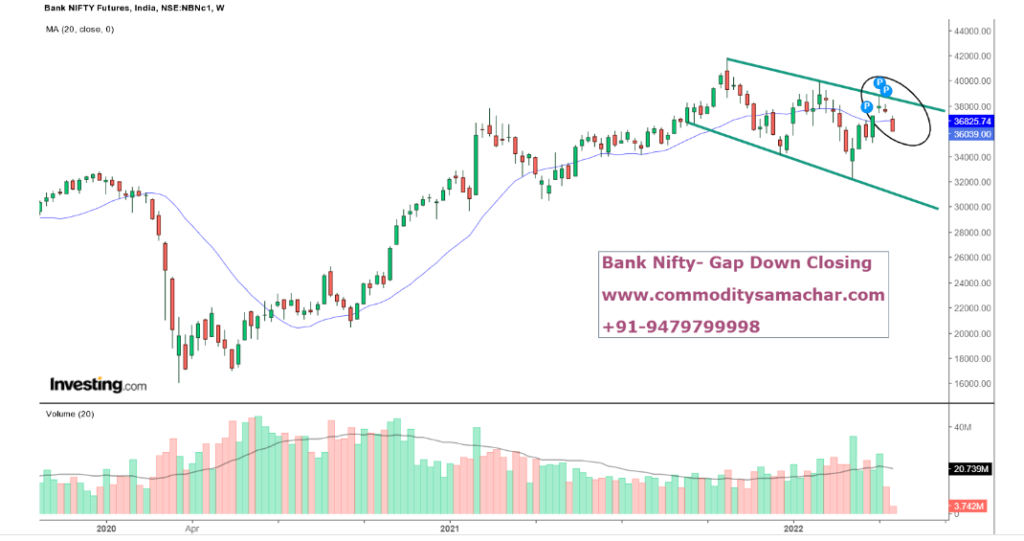
Today Bank Nifty opened at 36514.15 and made a high around 36578.95 but was unable to sustain at a higher edge thereby falling down by 771.35 points or 2.10% concluding a day at 36044.
Undoubtedly, on Thursday market goes up but is unable to maintain the higher levels. Consequently, build a path to trap traders and did a gap down opening. Today is Friday considers a settlement day for a week.
Furthermore, the Greed and Fear Index is at 67.39 which reveals a secret that greed persists. Earlier, the greed and fear index was at 87 which dips down and moves to 66 thereby showing strength in a downward direction.
If we look into the call and put ratio, then that numbers are not in favor of the market. Nifty PCR is at 0.92 and Bank Nifty PCR is at 0.60 with their maximum pain at 17300 and 36400 respectively.
Today, the Sensex was down by 714.53 points or 1.23% and ended lower at 57,197.15. There were 1447 shares that advanced, 115 shares remain unaffected, and 1882 shares declines.
All the sectors ended in red today. Be it capital goods, metal, health care, bank, or realty. Moreover, they nearly drop down by 1 to 2 percent each. Even the BSE both mid-cap and small-cap conclude with a red streak.
Nifty and Bank Nifty outlook

Nifty is forming a broadening pattern on the weekly chart and we expect to touch the downside boundary again. An unfilled gap of the weekly candle is showing negative momentum to remain continues in it. Although Nifty also settled below 20 days simple moving average. Therefore, we recommend to sell Nifty futures on the rise around 17300–17450 with a stop loss above 17700 for the downside target of 16300—15800 again.

On the other hand, the same view with Bank Nifty as it is unable to fill the gap on the weekly chart. A decisive close below 35900 will see more downside panic till 35300—34800 and then to 33500 levels in days to come. Traders can sell Bank Nifty on the rise around 36200—36450 with stop loss above 37200 for the downside target of 35300—34800.
Technical view for HDFC Bank

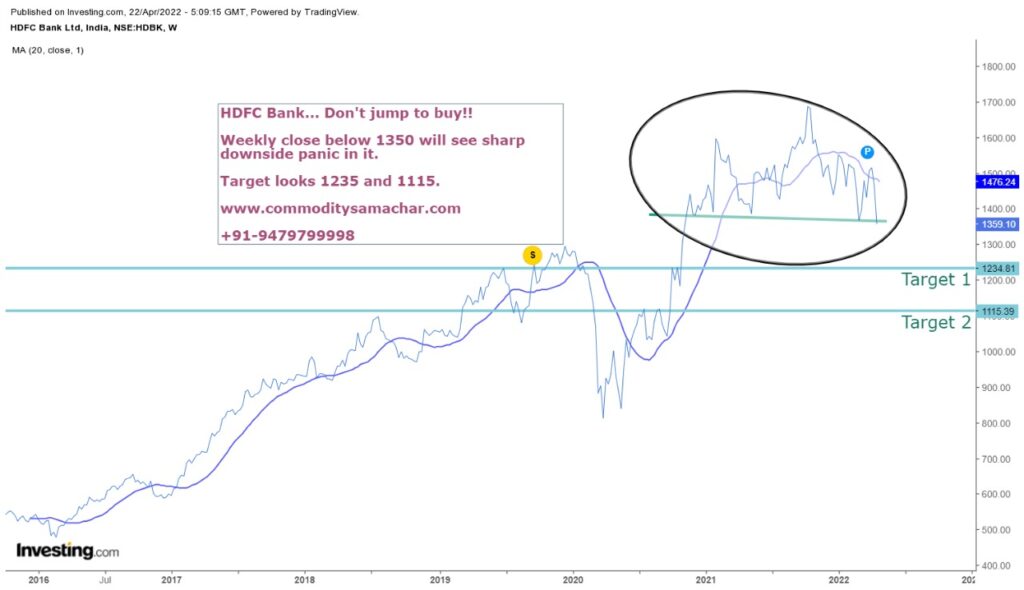
Chart patterns of HDFC Bank are forming a head and shoulder pattern. This is a pattern that portrays a trend reversal. Generally, when a pattern is a head and shoulder then there is a higher probability of a downward trend.
There were rumors all around that HDFC is going to merge with HDFC Bank. Since the rumors circulated, the stock prices of HDFC bank rises. Later on, when the rumors turn into reality then the prices dip down thereby consistently viewing a downward trend. This stock is favorite nowadays among retail traders and investors.
A decisive close below 1350 will take HDFC to 1235—1115 levels in days to come. Here we don’t recommend our subscribers to go long in HDFC Bank until and unless any major reversal is seen in this stock. HDFC bank has immediate resistance zone 1425—1475.
Stock market sector Alert
| PSU Bank | Looks weak below 20 weeks simple moving average | Support 2740 |
| Nifty metal | Negative pattern formation, sell only below weekly low | Support 6400 |
| Financial Services | Panic remains continues if break the weekly low | Support 16850 |
| Nifty IT | Who will save below weekly low | Support 31500 |
| Oil and Gas | Settled near to its resistance. Need to know will it break or fall again | Resistance 8500 |
| Auto Stocks | Weekly settlement in green. Could be supportive | Resistance 11150 |
