Today, the US releases retail sales numbers. US retail sales m/m drop to -1.2% which is below the forecast of -0.2%. This data gave a negative impact on base metals and the dollar. On the other hand, Core retail sales fall to -0.4%.
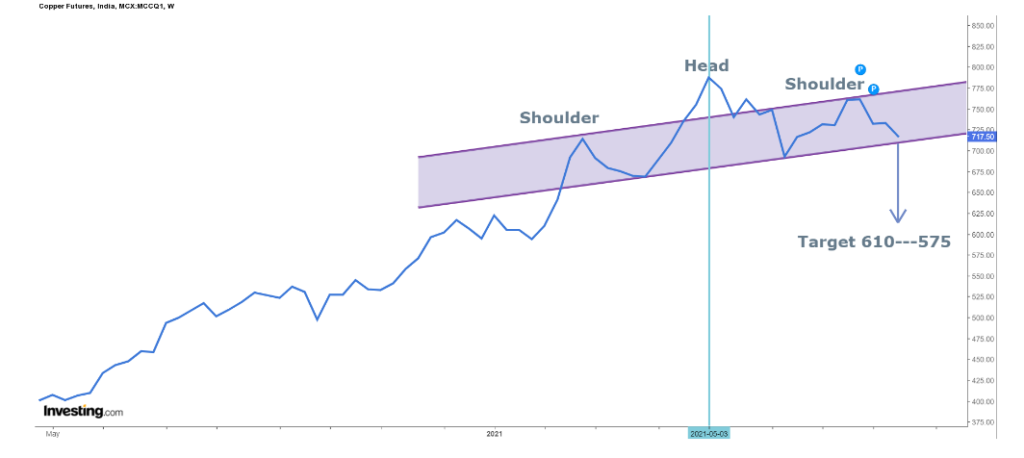
Copper looks scary as forming Head and Shoulder pattern on the weekly chart. We will see the pattern clearly on the line chart.
As shown in the figure, Copper recently made a high of 781.15 and now trading around 713 levels.

Copper made its all-time high of 812.60 and then a downward trend starts. The Head and Shoulder pattern neckline is at 710.
Will it break 710 or take a U-Turn???
Chances are bright for a downside move in it.
Three consecutive closes + weekly close below 710 will see a nonstop downside panic till 610—575 levels in days to come.
From the top to the center point… there is a difference of approx 100 points.
However, in this panic Copper could fill the gap which was made in the month of November around 560 levels
Hence, we recommend our subscribers that don’t go long in Copper until and unless you will get clear direction for the upside move in it. Trade as per levels given above.
If any reversal seems then surely we will update our blog.
