INTRODUCTION – Gold
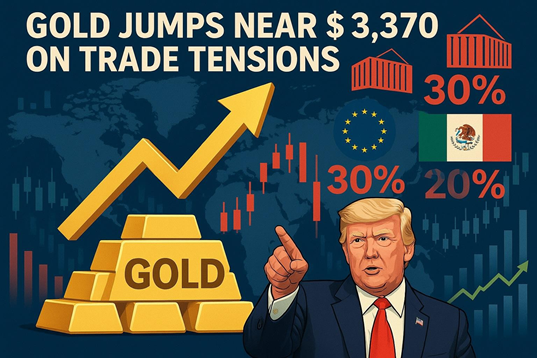
Gold prices climbed to a three-week high near $3,370 as fresh global trade tensions boosted demand for safe-haven assets. The rally followed U.S. President Donald Trump’s announcement of new 30% tariffs on the EU and Mexico, along with a broader set of duties targeting over 20 countries, including Japan and Brazil. With these measures set to take effect from August 1, market uncertainty has increased, pushing investors toward gold. While global equity markets showed mixed trends and the U.S. dollar and bond yields moved higher, gold stood out amid rising geopolitical risk. However, it may still face competition from other precious metals like silver and platinum, which are starting to gain traction. This week, traders will closely watch key U.S. economic data, including CPI, retail sales, and industrial output, for clues on the Fed’s next move.
KEY MACRO DRIVERS FOR GOLD
🔹 Escalation in Global Trade Tensions
- The U.S. administration announced 35–50% tariffs on over 20 countries, including Canada, the EU, Brazil, Japan, and South Korea.
- Formal letters sent to 23 nations highlight a hardline stance, with threats of further hikes depending on bilateral trade relations.
- The EU’s cautious response extending suspension of countermeasures until August 1signals ongoing uncertainty.
- Rising geopolitical and trade-related risks are reinforcing demand for safe- haven assets like gold.
- President Trump has now threatened secondary tariffs of 100% on Russia if no agreement is reached within 50 days. This could broaden the global trade conflict and add to gold’s appeal as a hedge against geopolitical risk.
🔹 Shift in U.S. Monetary Policy Expectations
- Federal Reserve Governor Christopher Waller’s recent dovish remarks have increased the probability of a 50 bps rate cut by year-end.
- This shift is exerting downward pressure on real yields, which continues to enhance gold’s relative appeal in a low-rate environment.

🔹 U.S. Inflation Data in Focus (CPI – July 16)
- The June CPI release will be closely watched to assess whether import tariffs are beginning to impact consumer prices.
- A softer print would likely reinforce dovish Fed expectations, supporting gold prices; a strong print could trigger short-term volatility, though long- term fundamentals remain intact.
🔹 China’s Economic Indicators – Key Global Demand Signal
- Scheduled releases of Q2 GDP, Industrial Production, and Retail Sales will provide insight into the broader global growth trajectory.
- Weaker-than-expected Chinese data could amplify global slowdown concerns and further boost gold safe-haven status.
🔹 Continued Central Bank Accumulation
- Several emerging markets and BRICS nations continue to increase gold reserves as part of de-dollarization and portfolio diversification strategies.
- This structural demand provides a solid long-term underpinning for gold prices.
🏦 CENTRAL BANK & ETF TRENDS – STRUCTURAL DEMAND HOLDING FIRM
Central Banks:
Global central banks continue to be net buyers of gold, reinforcing its role as a key monetary asset. According to a recent survey:
- 95% of central banks expect gold reserves to increase over the next 12 months.
- Ongoing sovereign buying has helped establish a solid price floor around
$3,300, offering key downside support amid macro volatility.
Gold ETFs:
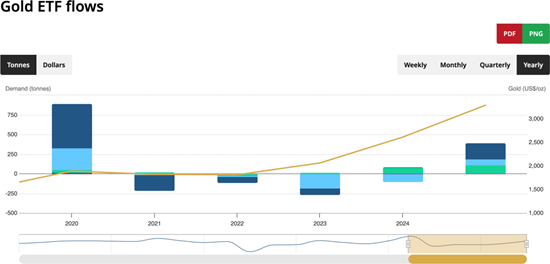
- Gold-backed ETFs recorded net inflows worth $38 billion in H1 2025, marking one of the strongest periods since 2020.
- North American funds led with approximately 207 tonnes, followed by Asia with around 104 tonnes, highlighting robust institutional and retail demand across regions.
- While SPDR Gold Trust holdings dipped slightly to 947.6 tonnes, the overall ETF trend remains bullish, reflecting continued interest in gold as a portfolio hedge.
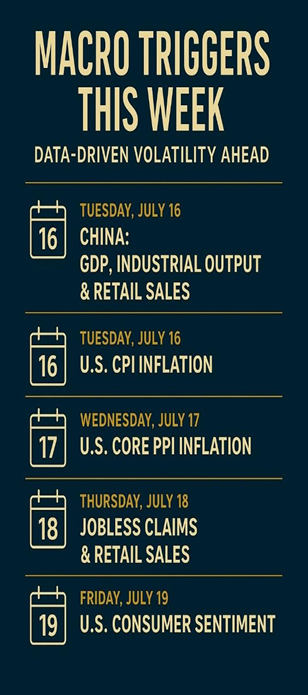
📅 Macro Triggers This Week: Data-Driven Volatility Ahead
This week brings a critical set of economic data that could drive precious metals volatility, especially with inflation and growth expectations in focus:
Tuesday, July 16 – China: GDP, Industrial Output & Retail Sales (07:30 AM)
- China will release Q2 GDP, Industrial Production, and Retail Sales data
- Industrial output is expected to decline for the fourth consecutive print, while GDP and consumption may also disappoint.
A broad miss could reinforce concerns over a slowdown in the world’s largest gold consumer potentially boosting safe- haven demand for gold but putting pressure on industrial metals.
Tuesday, July 16 – U.S. CPI Inflation (06:00 PM)
- The U.S. Consumer Price Index has shown moderation since February, but this release could surprise to the upside.
- A hotter-than-expected CPI reading would complicate the Fed’s rate cut outlook, putting near-term pressure on gold and silver.
- Inflation risks are also rising due to Trump’s new tariff policies; if this and the next inflation release show continued acceleration, markets could turn risk- averse, supporting gold eventually after initial volatility.
Wednesday, July 17 – U.S. Core PPI Inflation (06:00 PM)
- Core PPI (excluding food and energy) is also expected to rise, reinforcing supply-side price pressures.
- A dual inflation surprise (CPI + PPI) could raise market uncertainty, triggering volatility across assets but eventually acting as a tailwind for gold’s safe-haven appeal.
Thursday, July 18 – Jobless Claims & Retail Sales (06:00 PM)
- Weekly jobless claims may edge higher,retail sales are expected to show moderate growth.
- Mixed signals may keep the dollar range-bound, but investors will focus on Fed members’ speeches starting at 07:30 PM IST, which could influence policy expectations.
Friday, July 19 – U.S. Consumer Sentiment (07:30 PM)
- Sentiment has been recovering after falling sharply in the earlier part of Trump’s campaign.
- A stronger reading this week could weigh on gold and silver in the short term by signaling consumer resilience.
Outlook Summary
Most U.S. data this week is expected to trend higher, which could apply short- term pressure on gold and silver prices. However, underlying uncertainty—driven by tariff-induced inflation, Fed hesitation, and China slowdown fears—is likely to keep precious metals supported on dips.
◻ Traders should stay cautious near resistance levels and monitor real-time headlines, especially comments from Trump and Fed officials.
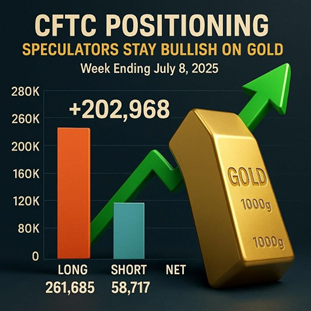
📊 CFTC POSITIONING – SPECULATORS STAY BULLISH ON GOLD
According to the latest CFTC data for the week ending July 8, 2025, hedge funds and large speculators (non-commercial traders) continued to maintain a strong bullish position in gold futures. The number of long positions rose to 261,685 contracts, while short positions stood at 58,717, resulting in a net long position of over 202,000 contracts. Compared to the previous week, long positions increased by 3,054 contracts, while shorts rose slightly by 2,066. Meanwhile, spread positions (neutral strategies) decreased, which shows that traders are becoming more directionally bullish rather than just hedging.
The total open interest in gold futures also grew by over 5,400 contracts, signaling increasing participation and interest in the market. Commercial traders typically producers or hedgers remain heavily short, as they usually sell into rallies to lock in prices. While this structure is normal, it does reflect that the market is approaching a more crowded long side, which could lead to short-term volatility if resistance levels hold or if key U.S. economic data surprises the market.
Overall, the CFTC report confirms a positive sentiment toward gold, with speculative traders showing increasing confidence in the upside trend supported by ongoing trade tensions, Fed rate cut expectations, and global demand from ETFs and central banks.
🔄 DIVERGENCE WATCH: SILVER OUTPACES GOLD – A SHIFT IN PRECIOUS METALS SENTIMENT
While gold has risen steadily on the back of safe-haven flows and geopolitical tensions, silver has decisively outperformed, rallying to its highest levels since 2011. This divergence is driven by a sharp pickup in investor appetite for undervalued assets, as well as strong technical momentum and robust demand from ETFs. The recent surge in silver is also supported by its dual role as both an industrial and monetary asset, making it more sensitive to macroeconomic shifts, particularly in China and manufacturing-heavy economies
Meanwhile, gold remains supported structurally but is encountering profit-taking and near-term resistance amid a stronger U.S. dollar. Despite this, the broader sentiment across precious metals remains bullish. Silver breakout has also triggered a reassessment of relative value, with many traders now eyeing gold as a potential catch-up play if silver continues to gain traction.
The narrowing gold-to-silver ratio and increasing flow into alternative metals like platinum indicate a sector-wide re-rating. For investors, silver’s relative strength reinforces the depth of bullish sentiment across the precious metals complex and could serve as a leading signal for gold’s next move.
GOLD TECHNICAL OUTLOOK:
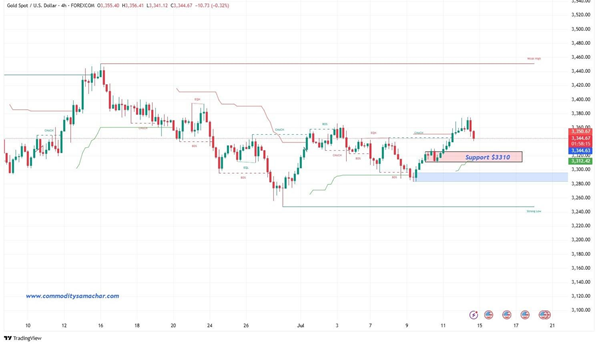
Gold is trading in a sideways range, with strong resistance near $3,375–$3,400 and key support between $3,310–$3,280. Price action has been choppy, and momentum is currently neutral, awaiting a clear breakout in either direction. A buying opportunity may arise near $3320–$3,310, with a stop-loss below $3,280.
If support holds, gold can bounce back toward $3,370 and possibly retest the
$3,400 resistance zone. However, traders should avoid entering long positions close to resistance without confirmation. If gold breaks below $3,280, that would signal weakness, and a move toward $3,245, and then possibly to $3,200, may follow.
On the flip side, if gold breaks out above $3,400 with strong momentum and volume, it could trigger a bullish continuation, pushing prices toward the next upside targets of $3,450 and $3,480.
MCX Gold is currently trading in a sideways range, with strong resistance between 98,500–99,050 and key support in the 96,500–95,800 zone. Price action has been choppy on lower timeframes, but the weekly chart structure remains positive, showing a pattern of higher lows a sign that the broader trend is still supportive of buying on dips.
A buying opportunity may arise around 96,500, where previous demand has shown strength. Traders can consider buying near this zone with a stop-loss below
₹95,800. If the support holds, gold can rebound toward 98,000–98,500, and potentially retest the ₹99,050 resistance zone. However, avoid fresh buying near resistance unless there’s a confirmed breakout above 99,050.
If MCX Gold breaks below95,800, downside pressure may increase, with the next support levels at 95,200 and 94,500. But as long as prices stay above 95,800 on a closing basis, the weekly structure stays intact with bullish potential.
On the upside, a sustained breakout above 99,050 could trigger a strong upward move toward 99,800 and 1,00,500 in the coming days or weeks.
CONCLUSION:
Despite near-term choppiness, gold’s fundamental backdrop remains robust. Escalating trade tensions, dovish Fed expectations, and persistent central bank buying continue to reinforce its role as a reliable hedge in an increasingly uncertain global environment
Speculative positioning and ETF inflows show that investor confidence in gold’s long-term potential is intact. While silver’s outperformance highlights sector- wide strength, it may also set the stage for gold to catch up once key resistance levels are breached
Technically, the broader trend favors buying on dips as long as critical supports hold. Short-term data-driven volatility should be seen as an opportunity rather than a threat disciplined traders can capitalize on these swings while respecting well-defined stop-loss levels.
In short, gold remains well-supported, with any correction likely to attract renewed buying interest. Staying nimble, managing risk, and focusing on the bigger picture will be key to navigating what remains a constructive environment for the precious metals complex.