
👉Factors Driving the Bullish Momentum
The recent dynamics in the market have been influenced by several key factors, including the impact of US Consumer Price Index (CPI) data, the performance of the US dollar, and fluctuations in US yields. The CPI, in particular, has played a pivotal role in shaping market expectations, with a lower-than-expected monthly CPI contributing to a decline in the US dollar, as measured by the US dollar basket (DXY). This, in turn, has provided a favorable environment for gold, as lower interest rates reduce the opportunity cost of holding the non-interest bearing asset. Additionally, the sharp decrease in US Treasury yields has further bolstered the positive catalyst for gold, contributing to its upward momentum. 📉💵
👉Gold’s Potential Breakout and Bullish Continuation
The recent surge in gold prices suggests a potential breakout and the continuation of a bullish trend. Market observers anticipate that gold prices might test the all-time high, should the current bullish impetus evolve into a sustained push higher. The softer CPI data and a more dovish adjustment in interest rate expectations have been key drivers in this regard, as the market prices in the possibility of two full rate cuts by the year-end. The recent closure of the daily candle above trendline resistance signifies a revitalization of the longer-term bull trend, paving the way for potential retests of prior resistance levels, now turned into support. 📈✨
👉Gold Volatility and Long-Term Bullish Momentum
While the recent developments have fueled optimism for a bullish trend in gold, it’s important to note that sustained bullish momentum hinges on various factors, including heightened volatility and the broader economic landscape. Gold prices are known to thrive in volatile environments, often influenced by risk-off sentiments and market nervousness. Although the prospect of lower interest rates has been supportive of higher prices, it may prove insufficient to sustain a long-lasting push higher. At present, the longer-lasting bullish momentum for gold remains to be seen, with the potential for more aggressive rate cut expectations in response to material weaknesses in the US economy or job market. 🌐📊
👉The current market sentiment and recent developments point towards a potential bullish trend for gold prices. The interplay of factors such as CPI data, the performance of the US dollar, and fluctuations in US yields has set the stage for a potential breakout and sustained bullish continuation. However, the sustainability of this bullish momentum will depend on a confluence of factors, including heightened volatility and the broader economic landscape. As such, market participants are advised to closely monitor key resistance and support levels, while remaining attuned to potential catalysts that could further drive gold prices in the coming period. 🔍💡
👉View On Gold for the next week🪙
The price of gold continued its upward trend on Friday (17 May) and on a decisive break above $2,400 per ounce, with spot gold up 1% to $2,418.88 per ounce as of writing . The large amount of mixed data released in the US on Thursday, with Fed officials reiterating that inflation is still not falling fast enough to consider a rate cut, led to a slide in the US dollar and US Treasuries, which had an overall neutralizing effect on gold prices.
Gold prices are on track for a second consecutive week of gains after hitting a one-month high on Thursday, with gold prices up 1 per cent so far this week. Demand from China, which has fueled the rise in gold prices in recent months, is becoming increasingly important as the market waits to see if high gold prices will prompt some central banks to slow down their purchases and as money continues to flow out of physically-backed gold-listed exchange traded funds.
Next Wednesday will see the release of U.S. home sales data for April, as well as the minutes of the FOMC’s April/May monetary policy meeting. Next Thursday, the market will receive the S&P Manufacturing and Services Purchasing Managers’ Index (PMI) preview data, weekly initial jobless claims, and April new home sales data. Next Friday will see the release of the durable goods report for April.
👉In the 4-Hour timeframe, gold has formed a cup and handle pattern with a bullish breakout, signaling optimism in price movement. This pattern typically suggests a potential upward trend continuation. Moreover, in the daily timeframe, there’s evidence of a higher high and higher low formation, further supporting the bullish sentiment.
🔸Adding to the analysis, there’s been an expansion in the Bollinger Bands, indicating increased volatility could potentially present both opportunities and risks for traders.
🔸In terms of Fibonacci retracement analysis, the price has breached the 0.38 level at 73300. If the price manages to close above this level, it could indicate further upwards momentum, with the next target possibly reaching the 74200 level.
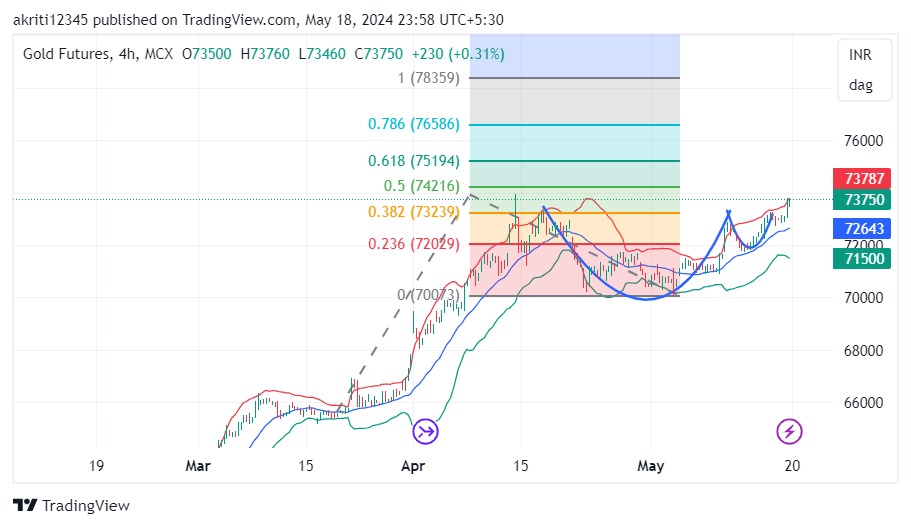
👉However , its important to note key support levels as well. Weekly support is observed at 71700, suggesting a potential level where downward movement may find some stability.
Considering these technical indicators, a strategy of buying on dips could be recommended. This approach involves taking advantage of temporary downward movements in price to enter long positions, with the expectation of benefiting from the overall upward trend. Traders may want to monitor price movements closely and adjust their strategies accordingly to capitalize on potential opportunities in the Gold Market.
👉For the next week we are loaded with FED members speech including Powell and many other FED members ,also PMI data is going to be released. All eyes should now be on silver and other metals, their movement will only explain where gold will move ahead. Today analysis of silver is more important so will provide all its level and accordingly plan the gold trades. For silver first range should be $32.00—$31.10, wait once silver gives a breakout gold will follow. It’s the same parabolic rise as we had earlier seen in Gold, so this may not retrace back so soon.
👉DXY looks strong only if closes above 104.80 so till then wait patiently. This market need to be traded wisely at breakouts only. For all trades use the resistance and support once broken then take advantage and take small profits till directional clarity doesn’t prevail.
👉For the next week just, market surely is in a bullish trend however important level would be $2390 for all long trade this should be the stop & between $2355—$2390 would be a no trade zone. Once we are out of this then take a directional move. Its an overbought RSI and all time highs need to be traded with strict stop.
👉For this week $2430—$2390 level need to be seen how it gets respected & INR terms 74200—73200. Once these levels are broken then $2455—$2355 which ever side we go and INR 74500—-72800
Happy Trading!
Commodity Samachar
Learn and Trade with Ease
Want to know what’s the hottest news in silver?
Check out our latest video now!!
Also Read: Pound Holds Steady as Aussie Dollar Firms Amid Optimistic Market Sentiment
Recommended-RBI MPC Meeting 2024: What’s On the RBI’s Radar?
Want help on your Trade?
Chat with an Analyst