Zinc is considered the 4th widest used metal in the world after steel, aluminium or copper. In the commodity market, it has quite a lot of significance and volatility in market concerning zinc can bring about a lot of shifts. According to recent data, there is a confirmed downward trend.
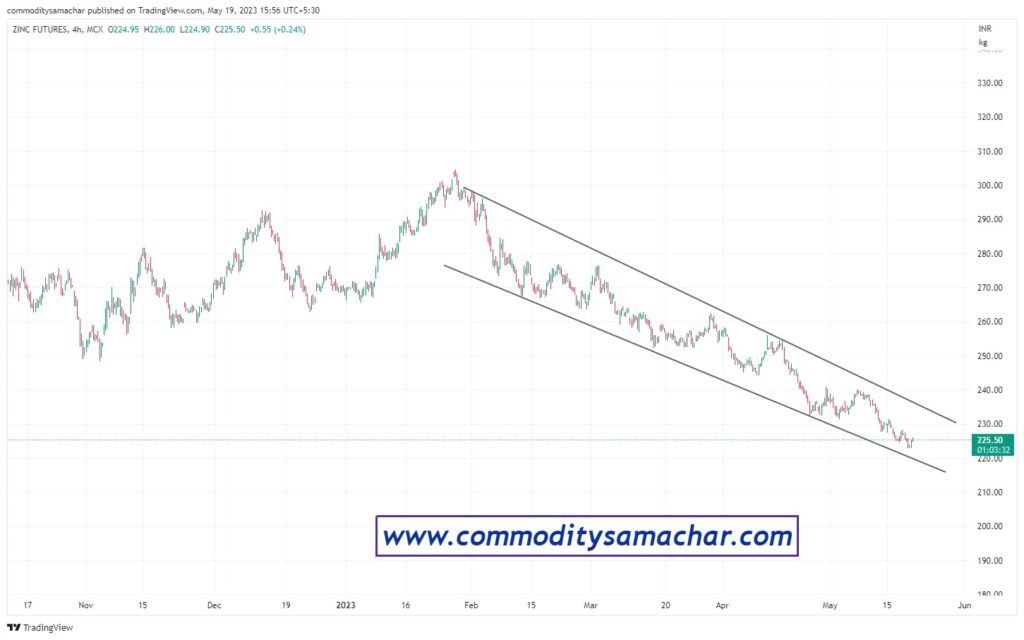
As per reports from top analysts, on Friday, May 19th, the Zinc chart is depicting a falling wedge pattern. For readers who don’t know what this phenomenon is, let us help you understand.
Wedge Chart Pattern:
A wedge chart can be simply described as the convergence or meeting at a crossroad direction of trend lines on a particular chart. The two lines are drawn over the candlesticks to understand the trajectory of the path. Research analysts comprehensively analyze the price series throughout about 10 to 40 periods by drawing tangents according to the support and resistance.
Falling Wedge Chart Pattern:
A falling wedge chart pattern usually occurs because of the fall over time in a securities price. This wedge chart pattern occurs when the trend makes a downward trajectory. The trend line leads to crossing or union indicating to traders that the price slide is losing momentum and buyers can step in, buy in or slow the downward pattern.
Technical Outlook:

As per the recent technical analysis reports, traders should be cautious around lower levels at 220. A ‘buy’ expectation is surrounding the point of lower levels that would retest towards the upper boundary again on levels admeasuring 235.
It is also observed that zinc is on a downside trajectory. If it is bound to break the levels at 235 with a significant volume, then traders are bound to see a sharp move of 20-30 points in the future.
We’ll be back again with more info soon, so stay tuned. Until then, hope you have great trades in the commodity market.
Commodity Samachar
Learn, Understand and Trade with Ease
