
Global supply squeeze + tariff fears + green energy demand create perfect storm
Copper Prices Are Heating Up Fast, Above $10,000/Ton Mark As Traders Brace For Potential U.S. Tariffs. The Combination Of A Looming Policy Deadline, Falling Inventories, And Robust Demand From Green Technologies Has Set The Stage For A Perfect Bullish Storm.
MARKET SNAPSHOT
⦁ LME Copper Price: $10,050/ton (as of July 3)
⦁ Day High: $10,070/ton highest since March 2025
⦁ Tom/Next Spread: $98/ton highest since 2021
⦁ Dollar Decline (YTD): 9.4%
⦁ Fed Outlook: Rate cuts expected, weakening USD further
Key Drivers Behind the Rally
- U.S. Tariff Deadline (July 9)
With the U.S. administration considering new tariffs, traders have rushed to ship copper into the U.S. ahead of time. This pre-tariff hoarding has sharply reduced global availability and spiked short-term demand. - Supply Crunch & Backwardation
A surge in copper shipments to the U.S. has drained inventories across China and LME warehouses. As a result, spot prices have risen above futures contracts a market structure known as backwardation, highlighting immediate supply strain. - African Mine Disruption
Flooding at one of Africa’s major copper mines has led to suspended output. This unexpected supply loss has added further tightness to an already-stressed global market.
4. Inventory Collapse:
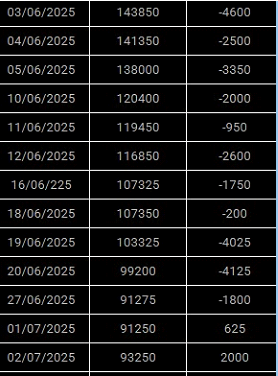
Copper inventories at the LME and in China have fallen steeply. This drop follows record shipments directed to the U.S. in recent weeks as traders moved early to avoid potential tariff hits.
- Green Energy Demand
Copper remains a critical metal in the energy transition story. With electric vehicles, solar infrastructure, and modern electronics ramping up, structural long term demand continues to rise. - Dollar Weakness
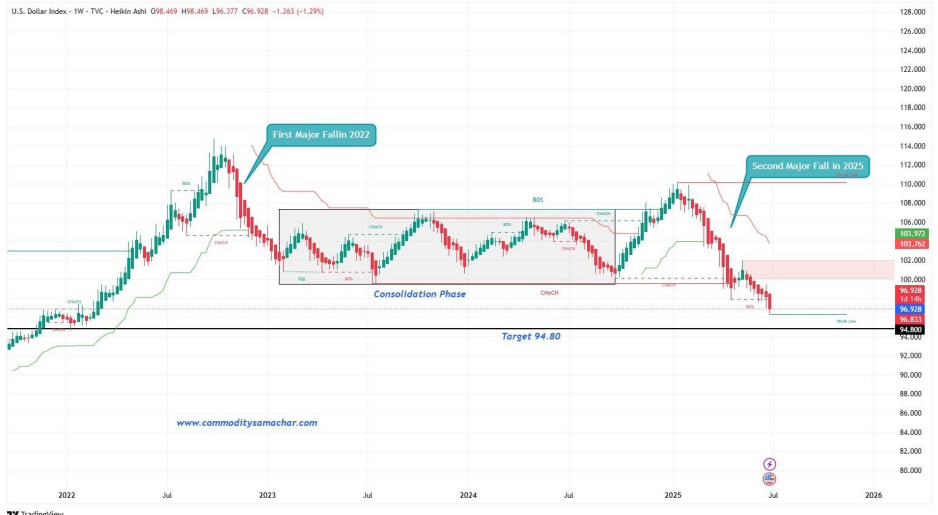
The U.S. dollar has dropped by 9.4% in the first half of 2025. A weaker dollar makes copper cheaper for foreign buyers, leading to greater international demand.
TECHNICAL OUTLOOK
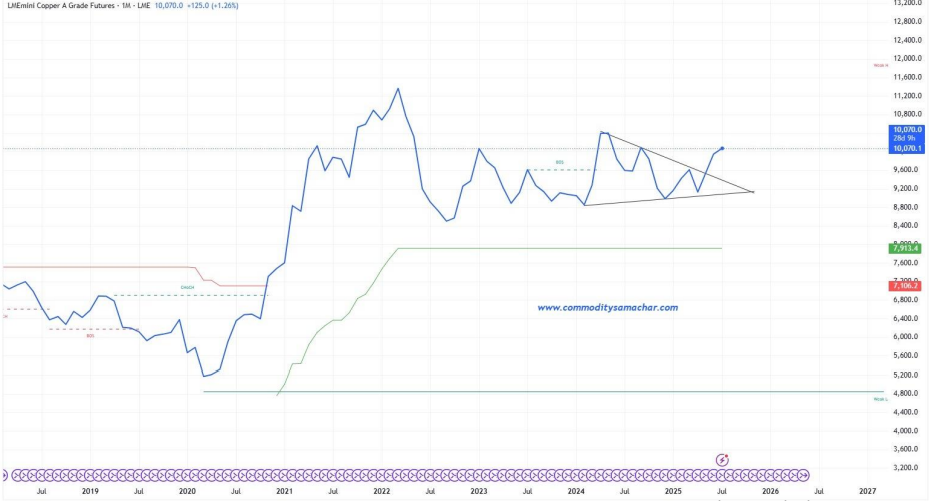
⦁ LME Copper: Now at its highest since November 2024
⦁ COMEX Trend: Bullish “double-bottom” pattern forming
⦁ Next Positional Targets: $10,400 → $10,880 → $11,350
⦁ India View: Stronger Rupee is capping copper gains on MCX
JULY 9: THE MAKE-OR-BREAK MOMENT
All eyes are on the upcoming July 9 deadline, when U.S. tariff policy may shift:
If tariffs are imposed: expect short-term volatility and possible supply panic.
If delayed or softened: profit-booking may pull prices down briefly.
Either way, the date is likely to be a high-impact event for copper markets.
WHO BENEFITS FROM THE RALLY?
🧾 ETF Winners
CPER: U.S. Copper Futures ETF
COPX: Global Copper Miners ETF
🌎 Countries with Leverage
Chile: Holds ~21% of global copper reserves
Peru: Holds ~9% — both set to benefit from higher exports & prices
COPPER FUNDAMENTAL+TECHNICAL
CONCLUSION
The copper rally is being fueled by short-term policy risk, supply disruptions, and
long-term structural demand. The charts are bullish, the fundamentals are tight, and
the macro environment remains supportive.
With July 9 approaching, traders and investors should prepare for heightened
volatility and potential opportunity