Natural Gas Prices posted more than five percent gains yesterday. That was the biggest intraday gain in two week. The prices spiked above two week high on forecasts for higher demand due to more hot weather through mid-August.
Meteorologists forecast the weather in the Lower 48 states will remain hotter than normal through at least August 19.
Refinitiv sees U.S. gas demand including exports rising to 105.8B cf/day next week from 102.4B cf/day this week, as power generators burn more of the fuel and exports rise.
The data provider said average gas production in the Lower 48 states averaged 102.2B cf/day so far in August, up from 101.8B cf/day in July and matching May’s monthly record.
U.S. exports of liquefied natural gas are also expected to grow substantially into 2024, and exported natural gas to Mexico is seen setting a new record.
Further, the sluggish move in the US Dollar also supported recent gain. However, the fresh doubts about the energy demand from the US and China hold some cautious trade.
The US Dollar Index remained in a cautious mood ahead of US inflation data release. That said, mixed signals from the Federal Reserve (Fed) officials also restrict the currency moves.
That said, Fed Governor Michelle Bowman as he said that additional rate increases will likely be needed to lower inflation back to target. However, the greenback dropped afterward as New York Fed President John C. Williams said he expects that interest rates could begin to come down next year. The policymaker also conveyed hopes of witnessing a slightly higher unemployment rate as the economy cooled.
It should be noted that China’s Ministry of Water Resources cited a stronger response for flooding to Level III in Inner Mongolia, Jilin and Heilongjiang while highlighting the recently escalating fears from typhoon Doksuri.
Natural gas inventory scheduled to release on Thursday, this may have some volatile move in the prices.
Technical Outlook

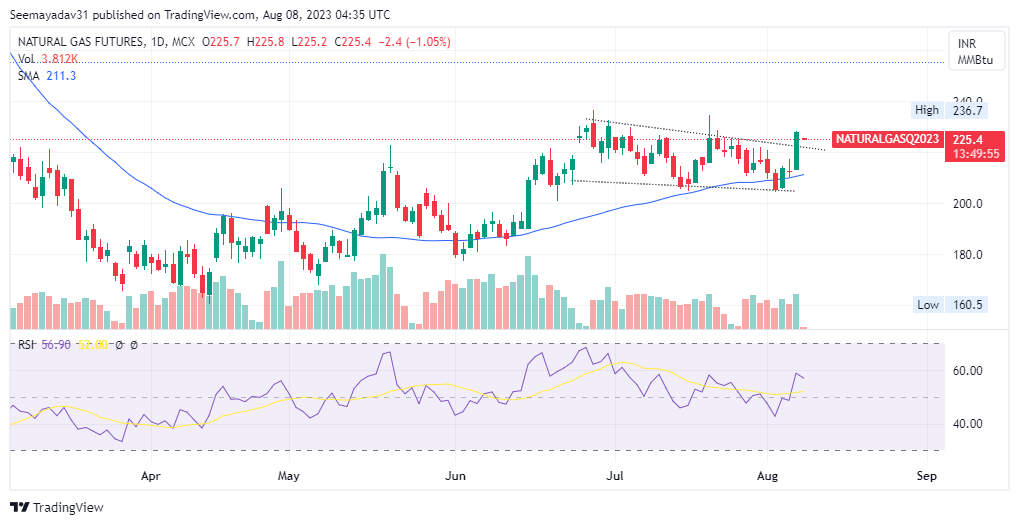
Natural gas witnessed a more than 7% jump yesterday. Prices inched higher to a two week high 228.20 and settled at 224.50.
Since the start of the month, prices turned positive and enjoyed recovery from the bottom of 204.40. Recent price action resulted in formation of a long bullish candlestick. Further, bullish rectangle breakout was also noted on the chart. Both of the above aspects on the chart indicate a bullish trend in the near future.
Hence, any dip towards 218-219 is likely to attract buying activities. Target is seen at 230-242.00 with a stop loss of 203.50.
Alternatively, on the downside crucial support is seen at 199.50 below it only prices may drop towards 192-185.00.
