
Crude Oil Market Analysis: Simple Explanation of Technical and Fundamental Factors
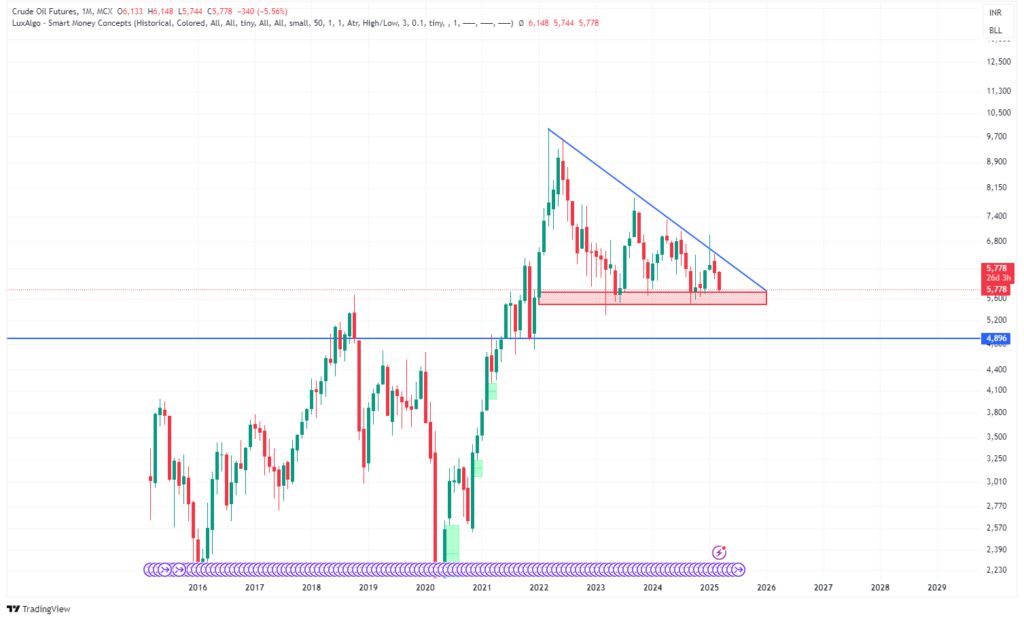
Crude oil prices are at a very important stage right now. The chart shows a big triangle pattern forming, where prices are making lower highs but staying above a strong support level. This means the market is waiting for a big move, either up or down, based on different factors affecting oil prices.
Technical Analysis
The triangle pattern usually means prices may drop, but sometimes it can also break upward. The red line on the chart is an important support level where buyers have stepped in multiple times. If the price falls below this level and stays there, we might see crude oil fall to 4,896 INR. On the other hand, if prices bounce back from this support, they could move up towards the resistance trendline.
If crude oil breaks above this triangle pattern, it would mean prices are reversing to an uptrend. In that case, we might see crude oil reach 6,500-7,000 INR in the coming months. But if it fails to hold the support level and drops, prices may go even lower, similar to what happened in early 2020.
Fundamental Analysis
There are many global events affecting crude oil prices right now:
- OPEC+ Production Cuts – The countries that produce a lot of oil (OPEC+) are deciding whether to cut production. If they reduce oil supply, prices will go up. But if they produce more, oil prices might drop.
- Global Oil Demand – Big economies like China and the U.S. are using less oil because of slow economic growth. If demand improves, prices might rise.
- Political Problems in Oil-Producing Countries – There are tensions in the Middle East and the ongoing Russia-Ukraine war. If these situations get worse, oil supply could be affected, making prices go up.
- U.S. Dollar Strength – When the U.S. dollar gets stronger, oil becomes more expensive for other countries, lowering demand. If the dollar weakens, oil prices could rise.
- Inflation & Interest Rates – When inflation is high and interest rates rise, people and businesses use less oil. If central banks start lowering interest rates, oil demand might increase, pushing prices higher.
Conclusion
Right now, crude oil is at a make-or-break moment. If the price stays above support and moves out of the triangle pattern, we might see a strong upward trend towards 6,500-7,000 INR. But if prices drop below support, crude oil could fall to 4,896 INR or even lower.
Traders should watch important news about OPEC+ decisions, economic conditions, and global political issues. The market could be very volatile, so it is important to have a proper plan to manage risks and make smart trading decisions.
Until then, Happy Trading!
Commodity Samachar Securities
We Decode the Language of the Markets
Also Read: RBI’s Liquidity Move: How It Impacts Indian Stock Market ? , America’s Gold Mystery: Is Fort Knox Really Full?
Recommended Read: India’s Semiconductor Surge: Powering the Future of Electronics!
Want Help On Your Trades ?