Hope you all are enjoying the rally in Maruti as we recommended buying above 7400 levels. Maruti already crossed 7650 levels. Head and Shoulder formation target shows 8400 levels. For more details, kindly click on the given link- https://commoditysamachar.com/wp-admin/post.php?post=1087&action=edit
Tata Steel

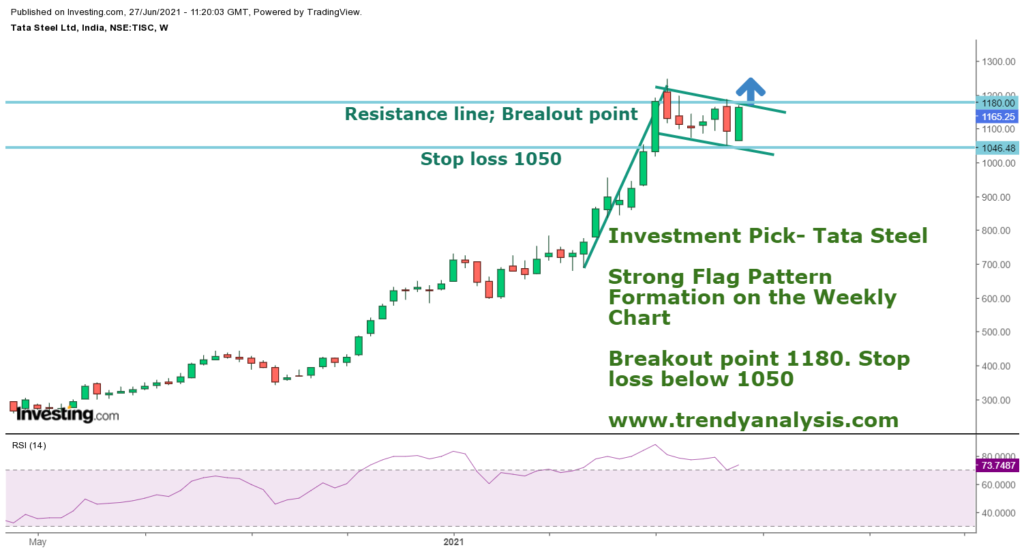
As shown in the figure, a strong Flag pattern formation is seen in the weekly chart. Tata Steel skyrocketed in the week and settled around 1165.25 levels. We have seen a rally in Tata Steel from the last few weeks as it has started its rally from 700 levels. So as per technical calculation, Tata steel could make a healthy move of 500+ points.
Now, what next???
Tata Steel has support at 1050 and resistance at 1180.
Two consecutive closes above 1180 will see a non stop rally in Tata Steel till 1580—1650+++ levels in days to come.
RSI and Moving average is still showing strength on the weekly chart.
So traders can go for investment in Tata Steel with stop loss below 1050 on a closing basis for the upside target of 1680—1750.
Our positive view gets negate on a close below 1050 levels only. If reversal seems then surely we will update. Be in touch with trendy analysis.
Recommendation: Buy Tata Steel above 1180. Stop loss below 1050. Target 1680—1750

One Comment
Great n experienced observation…