Zinc Prices completed its Corrective Elliot wave leg C, which is creating a probability for a near-term pullback. Prices found support. Markets, though, continued to be apprehensive since debt talks might stretch on. Following encouraging statistics on consumer spending and inflation in the United States, there are new concerns that the Federal Reserve would raise interest rates next month, which would reduce demand.
Zinc prices paused their recent falling stick on Friday. Prices were able to gain two and a half per cent. That is the first intraday gain since 8 May 2023 as U.S. officials’ possible negotiators will reach a deal to raise the U.S. government’s $31.4 trillion debt ceiling, having weighed on sentiment. Talks could easily spill over into the weekend, Biden administration official said.
Additionally, Democratic President Joe Biden and top Republican Kevin McCarthy in Congress tentatively came to an agreement late on Saturday. It was done to increase the borrowing cap for the US government and prevent a default that would have rocked the world economy.
The Treasury warned Friday that the government will run out of money to pay its bills by June 5. However, the agreement still has a long path to pass through the sharply divided Congress.
On Thursday, zinc prices plunged to their lowest level since July 2020 as exchange stockpiles increased and the market for the metal used to galvanise steel went into surplus due to sluggish demand.
Prices have plunged 35% from a high in January to an economic recovery in China. The major consumers of zinc turned out to be less robust than anticipated, while higher borrowing rates hampered growth elsewhere.
The weekly chart above reveals the entire price history of Zinc Prices since its inception of the Corrective wave ABC structure.
Technical View
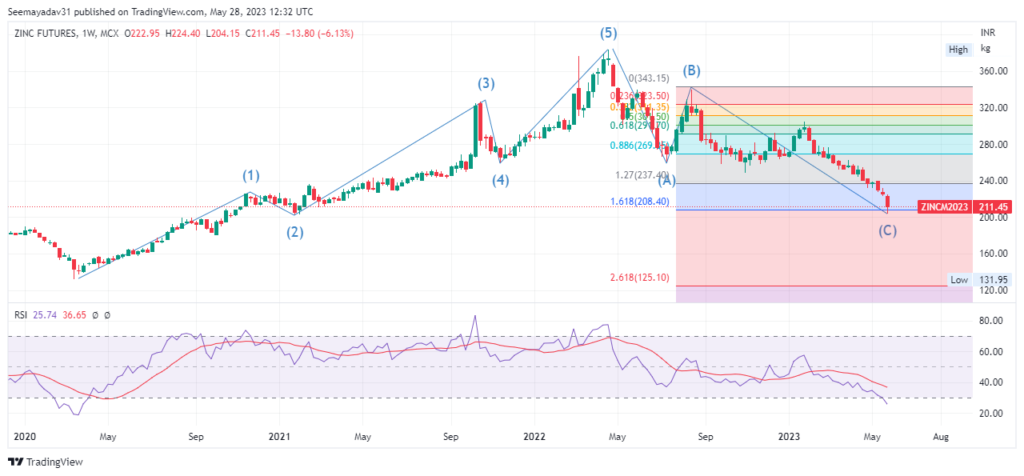
Zinc prices continued trading under the corrective phase from April 2022. Prices continued trading downside from the peak of 383.40 to a recent low of 208.40, coinciding with the 161.8% Fibonacci Retracement of its previous leg.
The above wave drawn on the chart is showing, Zinc prices completed corrective wave C. Now, prices are expected to witness a pullback towards 220-235 in the near future.
On the other hand, a sustainable close below 201.50 on a closing basis only will extend this wave further. And prices may drop towards 180-160 and below.
Hence, any dip towards 208-210 will provide a buying opportunity for the target 220-235 and above with a strict stop loss below 201.50 on a closing basis.