HDFC Bank, India’s prominent loaning private bank has recently stated a fall in standalone net profit by 1.7 percent which stood at Rs.3,000.7 crore as against Rs.3,051.5 crore YOY.
Moreover, the profit numbers were more than the estimation predicted by analysts. The Bank also stated a fall of 10.45 percent in total income from operations which stood at Rs. 11,657.47 crores as compared to 13,017.68 crores YOY.
Furthermore, the net interest income shows a gain of 22 percent which put up at Rs. 4,146.7 crores as against Rs. 3,392 crores in the year-ago.
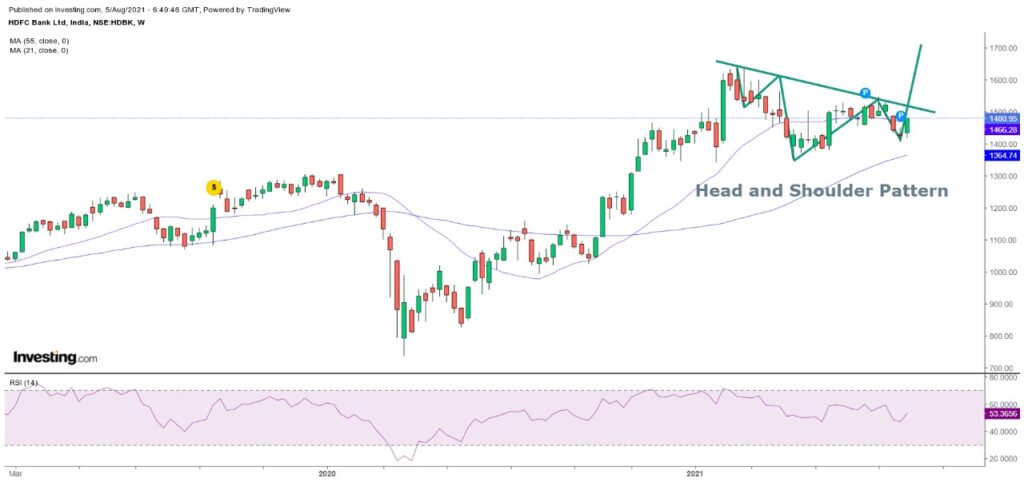
Further, HDFC Bank is forming a Head and Shoulder pattern on the daily chart as shown in the figure below.

Hurdle range 1490—1540. So traders remain cautious in the given range.
Three consecutive closes + weekly close above 1540 will take it to 1700+++ levels in days to come.
Will it cross the 2000 mark???
Our positive view gets negate on a close below 1400 levels.
Moving average 21DEMA and 55DEMA is at 1482 and 1364. A big gap in the moving average shows that there is much more strength remaining in the stock.
The market is in a bull run and chances are high to breach the resistance level of 1540.
Fundamentally it’s a good stock as it considers being the leading private bank in India. Consequently, our experts recommend you to go for investment for a long-term horizon. RSI is showing positive diversion whereas the moving average on the weekly chart supported the price of HDFC Bank.
However, Despite Covid-19 bank performed tremendously well and come up with a decent result of quarterly earnings.
Precisely, we would recommend our investors to buy and forget the stock for higher returns.